Tag: Carbon Cycle and Ecosystems

Carbon Cycle and Ecosystems

palouse_ast_2008205

NASA image created by Jesse Allen, using data provided courtesy of NASA/GSFC/METI/ERSDAC/JAROS, and U.S./Japan ASTER Science Team. Caption by Adam Voiland.

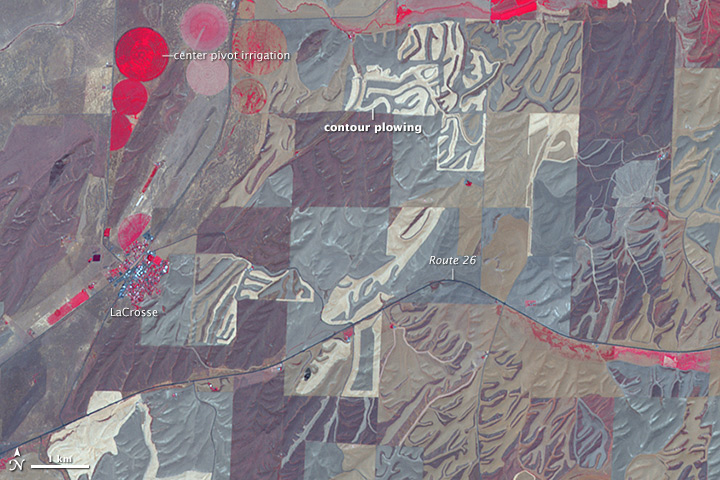
The Advanced Spaceborne Thermal Emission and Reflection Radiometer (ASTER) on NASA’s Terra satellite captured this image of farmland near LaCrosse, Washington, on July 24, 2008. The false-color image was assembled using infrared, red, and green wavelengths of light. This combination is useful for observing vegetation and monitoring its health. Areas with the most vigorous crops, grasses, and trees are bright red. Areas where vegetation is drying or dormant are darker shades of brown and gray. Areas with no red are likely fallow or being prepared for seeding. Read more

Canada_tmo_2014188_detail


A combination of lightning and dry forests fueled numerous wildfires in Canada’s Northwest Territories in July 2014. The fires, burning in Canada’s boreal zone, are producing dense smoke. As of July 8, at least 164 blazes had charred more than 425,172 hectares (1,642 square miles), according to the Canadian government. The fires destroyed one home, forced hundreds of people to evacuate, and sent smoke drifting as far south as the continental United States.

The Moderate Resolution Imaging Spectroradiometer (MODIS) on NASA’s Terra satellite captured this image of smoke billowing from wildfires near Faber Lake on July 7, 2014. Read more

NASA image courtesy Jeff Schmaltz, LANCE/EOSDIS MODIS Rapid Response Team at NASA GSFC. Caption by Adam Voiland.


NASA image courtesy LANCE/EOSDIS MODIS Rapid Response Team at NASA GSFC. Caption by Holli Riebeek.

High winds propelled a wildfire through parts of Valparaiso, Chile, on April 13, 2014. It quickly became the largest fire in the history of this port city. The fire started in a forested area on April 12 and eventually reached wooden homes built on steep hills around the city. According to news reports, at least 12 people died, 2,000 homes were destroyed, and about 10,000 people evacuated as the fire moved through a section of the historic city.

The Moderate Resolution Imaging Spectroradiometer (MODIS) on NASA’s Terra satellite acquired this image of the fire at 11:10 am local time (14:10 UTC) on April 13. Fire detections are outlined in red in the forest south of the city, which is pale gray. A long plume of smoke stretches northwest over the Pacific Ocean, a clear indication that winds were strong and blowing the flames toward the city. Read more

NASA image courtesy LANCE/EOSDIS MODIS Rapid Response Team at NASA GSFC. Caption by Holli Riebeek.

NASA Earth Observatory image by Robert Simmon, using data from Patrick Jantz and Alessandro Baccini at Woods Hole Research Center. Caption by Mike Carlowicz.

“To create the corridors, Jantz started with a tropical carbon map that Goetz, Laporte, Alessandro Baccini, and other WHRC scientists developed a few years ago. That map included data from NASA’s ICESat, Terra, and Aqua satellites, Japan’s ALOS satellite, the Shuttle Radar Topography Mission, and from thousands of ground-based observations. The tropical carbon map became the base layer on the map above.” Read more

NASA Earth Observatory image by Robert Simmon, using data from Patrick Jantz and Alessandro Baccini at Woods Hole Research Center. Caption by Mike Carlowicz.

NASA Earth Observatory image by Jesse Allen, Earth Observatory, using data provided by Inbal Reshef, Global Agricultural Monitoring Project. Caption by Mike Carlowicz.

Persistent dry weather has grown more worrisome in the American West, with nearly two thirds of the region experiencing some level of drought. By most measures, the state of California is suffering through the worst of it. The effects of the dry spell are visible in the mountains, where snow pack is lacking, and now in the vegetation cover on the landscape. Nearly all of California was in a state of extreme drought at the end of January 2014. The past three months (November to January), six months (since August) and twelve months were all the driest periods in California since record-keeping started in 1885. From February 1, 2013, through January 31, 2014, a statewide average of 6.97 inches (177.04 millimeters) of rain fell; the norm is 22.51 inches (571.75 millimeters). The map above shows the impact of drought on California’s farms, forests, and wild lands. Based on data from the Moderate Resolution Imaging Spectroradiometer (MODIS) on NASA’s Terra and Aqua satellites, the map contrasts plant health from January 17 to February 1, 2014, against average conditions for the same period over the past decade. Read more

NASA Earth Observatory image by Jesse Allen, Earth Observatory, using data provided by Inbal Reshef, Global Agricultural Monitoring Project. Caption by Mike Carlowicz.