Month: May 2018


On May 6, 2018 as Kilauea continued to erupt, MISR passed overhead at approximately 11 a.m. local time, capturing this view of the island. While much of the island is covered by clouds, the eruption plume is visible streaming southwest over the ocean starting at the fissure on Hawaii’s eastern point. MISR uses it’s unique, nine-angle view to calculate plume height. This image is from one of MISR’s forward pointing cameras. The plume height is relatively low, meaning that gas and ash are staying near the ground, potentially causing health risks from poor air quality downwind.

Read more:


Ash from Kilauea Eruption Viewed by NASA’s MISR on NASA JPL’s Photojournal


When volcanoes erupt, ASTER turns its attention to documenting the changes to the landscape as they happen. ASTER is uniquely capable of turning to see areas where volcanoes are erupting in very high resolution (between 15 in the thermal bands – 90 meter spatial resolution in the visible light spectral bands).

As Hawaii’s Kilauea continues to erupt, ASTER continues to monitor the eruption from space. This image from May 6, 2018 shows the sulfur dioxide being released from the volcano in yellow and yellow-green.

Read more:

Satellite View of Kilauea Eruption from NASA JPL


NO2 and CO mean differences  maps

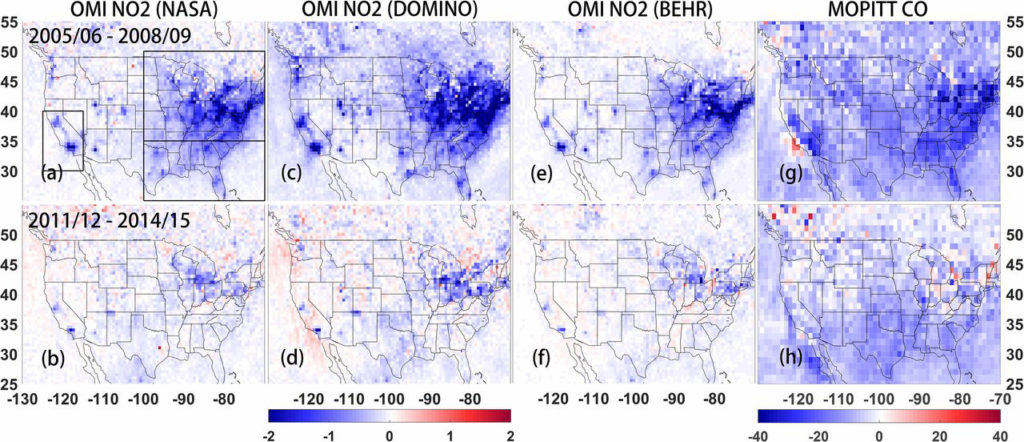
Difference of mean tropospheric OMI NO2 columns from 2005–2006 to 2008–2009, and from 2011–2012 to 2014–2015. The unit is 1015 mole/cm2. (G and H) same as A–F, but for MOPITT surface layer CO measurements with unit ppb (parts per billion).

A recent article published in PNAS points out that efforts to reduce nitrogen dioxide and carbon monoxide emissions between 2011 – 2015 have slowed in the United States, despite previous estimates that emissions were decreasing. These “bottom-up” estimates used ground-based measurements, inventories and models to predict these smog-producing emissions. However, when viewed from above, through satellite data from MOPITT and OMI, both nitrogen dioxide and carbon monoxide levels have not decreased.

Researchers concluded that emissions, especially for nitrogen dioxide, have not decreased as thought because of vehicle and industrial emissions. Industrial and construction equipment emissions are growing, while heavy duty truck diesel emissions may have been overlooked in ground-based measurements.  Car emissions also continue to be a pollution source, but are now contributing a smaller proportion of total emissions.

One thing is certain, that viewing from above gives scientists the opportunity to see the whole United States, instead of relying on site specific ground based measurements.

Read more about it in the news:

Los Angeles Times: Slowdown in emissions reductions could explain stalled progress on smog, study finds

Bloomberg: Your air isn’t getting as clean as the EPA said it is

USA Today: The USA’s long battle against air pollution isn’t over yet, as air quality improvements are slowing down

Associated Press (on Tampa Bay Times website): America’s air isn’t getting cleaner as fast as it used to

MISR with it’s multiple angled views of the Tinder fire, makes it uniquely capable of tracking the plume height and direction of one of the first fires of the 2018 season in the United States. The fire started on April 27th, 2018 from an abandoned campsite and quickly spread through, Cococino National Forest in, eastern Arizona. This MISR data is from April 30th, 2018, showing the plume height and direction. The plume reached nearly 4 kilometers high near the source of the fire. Typically the higher a plume reaches, the further the impact extends. Scientists are using data like this to better understand how fires impact air quality beyond the source area.

Read more:

Using Satellites to Track the Tinder Fire  on NASA Earth Observatory

Tinder Fire in Arizona Viewed by NASA’s MISR from JPL’s Photojournal