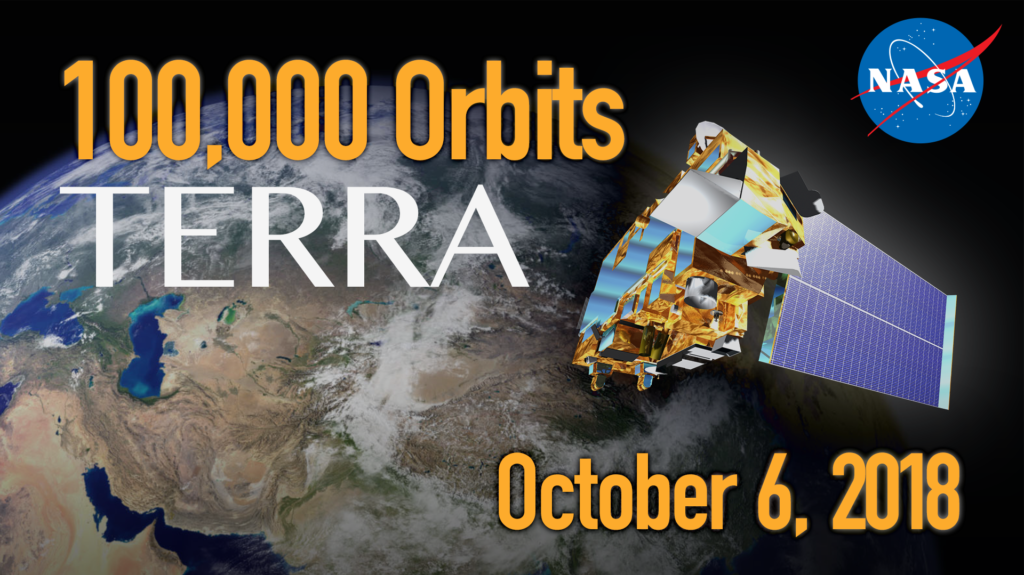
 More than 400 miles above Earth, a satellite the size of a school bus is earning its frequent flyer miles. On October 6, 2018 Terra completed 100,000 orbits around Earth. But just as a plane can’t fly without a crew, the Terra satellite never could have reached this milestone without decades of dedicated work by talented engineers and scientists.
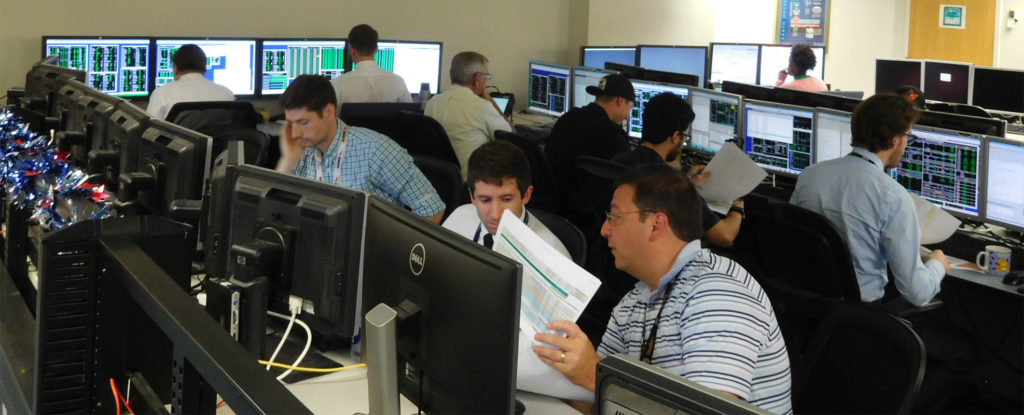
Completing over 2.5 billion miles of flight around Earth over almost 19 years does not happen unless a satellite is designed, constructed, and operated with the greatest care. “You have multiple, different aspects in the team to make it work,” says the Deputy Project Manager – Technical at NASA’s Goddard Space Flight Center, Eric Moyer.
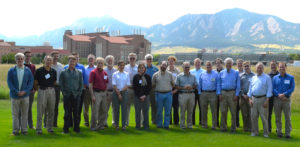
The Terra working group, including representatives from science teams, instruments teams, and flight operations teams met in Boulder Colorado in 2015.
“You have flight operations, subsystem engineers, subject matter experts, the instrument teams, and the science teams for each of the instruments. Overall it all has to be coordinated, so that one activity doesn’t negatively impact another instrument,” explains Moyer, who worked on Terra during construction and continues to be involved with its operations today.
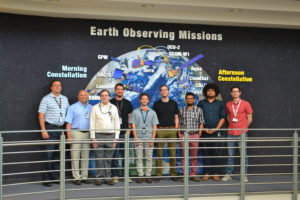
The offline Terra mission operations team stands in front of an image of the fleet of NASA Earth Observing Satellites
Terra joins a handful of satellites to mark this orbit milestone, including the International Space Station, Landsat 5 and Landsat 7. Terra, which launched December 18, 1999, is still going strong and is projected to continue operation into the 2020s.
Dimitrios Mantziaras, Terra Mission Director at NASA’s Goddard Space Flight Center, sums up what it takes: “A well-built spacecraft, talented people running it and making great science products, with lots of people using the data, that’s what has kept it running all these years.”
Designing a Pioneer
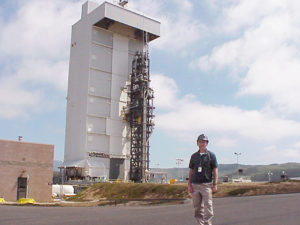
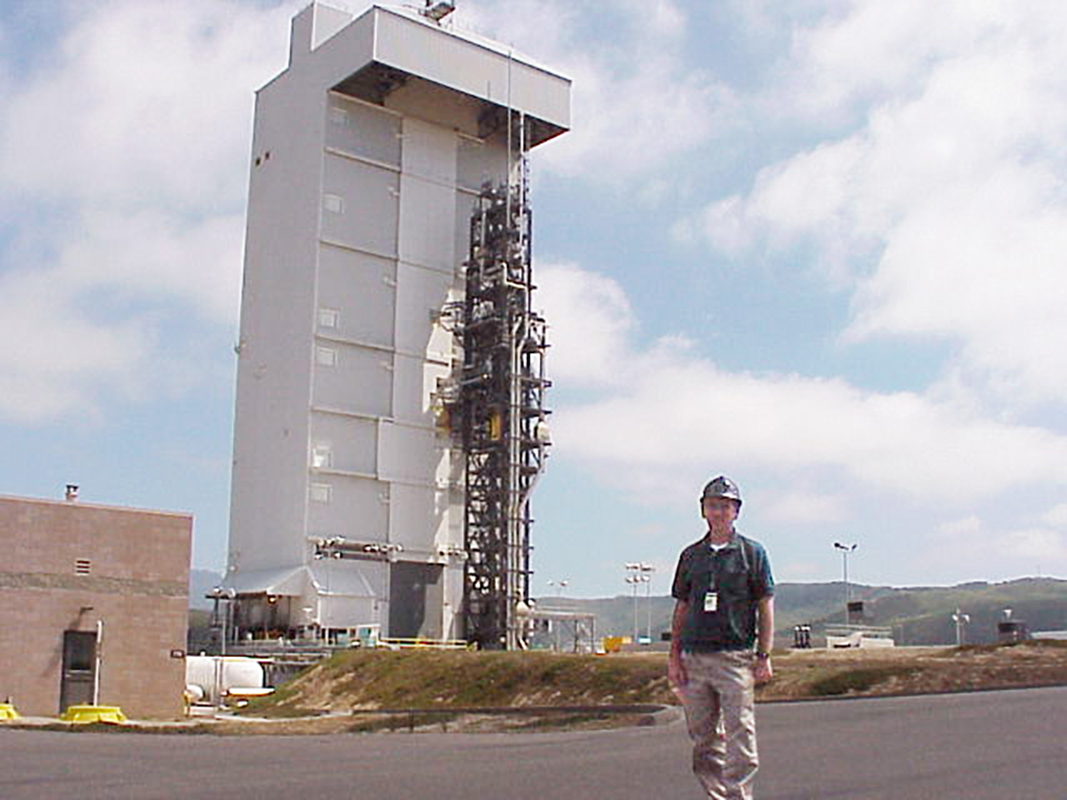
Dick Quinn stands in front of Terra on its launch vehicle, an Atlas IIAS rocket. Terra launched December 18, 1999. Image courtesy of Dick Quinn
Terra was unique from the beginning. It was the first satellite to study Earth system science, looking at land, water and the atmosphere. Unlike many previous, smaller satellites, Terra didn’t have a previously launched satellite platform to build upon. It had to be designed from scratch.
“Unlike the Landsat mission, that continues to improve upon its original design, nothing like Terra had ever been built,” says Dick Quinn, Terra’s spacecraft manufacturing representative from Lockheed Martin, who still works part-time with the team responsible for Terra’s continued flight.
Terra was meant to be the first in a series of satellites, known as AM-1, 2, and 3, each with a design life of about 5 years. Instead, they ended up designing a satellite that lasted longer than the combined design life of 3 generations of Terra satellites.
Constructing and Operating a Solid Satellite
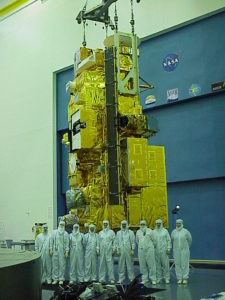
Terra’s test team stands in the clean room in front of Terra during Terra’s construction and testing phase.
The built-in redundancies and flexibility of the satellite were put to the test in 2009, when a micrometeoroid struck a power cell, degrading the thermal control for the battery. “We had to change the way we manage the battery to keep it operating efficiently and keep it at the right temperature.” says Jason Hendrickson, Terra flight systems manager at Goddard Space Flight Center, who joined the team in 2013. To do this, the team used the charge and discharge cycle of the battery itself to generate the heat necessary to keep the battery operating. They have been fine tuning this cycle ever since.
Terra engineers and scientists continually plan for worst-case scenarios, anticipating problems that may never develop. “We are always thinking, if this were to fail, how are we going to respond?” says, Hendrickson. “You can’t just go to the garage and swap out parts.”
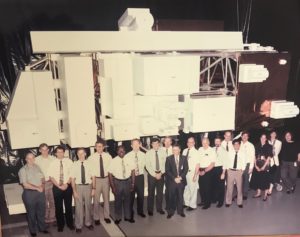
The NASA team of scientists, engineers and designers pose for a group photo in front of a true-to-size model of Terra.
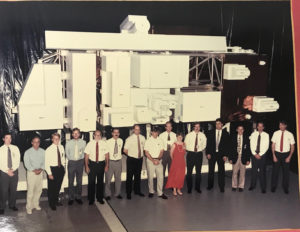
Members of the design team stand in front of a model of Terra in the mid 1990s.
Not only does the team plan for many possible scenarios, but it also looks back at the response and figures out how it can be improved.
However, most of the time, they don’t have to wait for a system failure to practice contingency plans. For example, in 2017 the team executed a lunar deep space calibration maneuver that turned the satellite to look at deep space, instead of at Earth. “We had to take into account what would happen if the computer were to fail when we were pointed at deep space,” says Hendrickson.
The mission operations team executes the Lunar Deep Space Calibration Maneuver in 2017. Image courtesy of Kurt Thome.
The calibration maneuver was executed successfully and the team never had to conduct their contingency plan. The science gained from calibrating Terra’s data against deep space, allowed the scientists to improve the data collected by the Advanced Spaceborne Thermal Emission and Reflection Radiometer (ASTER). ASTER is one of five instruments on Terra. It monitors volcanic eruptions and provides high resolution imagery of locations all over the world.
In addition to ASTER, the instruments on Terra are:
- • The Moderate Imaging Spectroradiometer (MODIS) protects people’s lives and property through operations like MODIS rapid response, which monitors wildfires daily. Additionally, MODIS collects data on land cover, land and sea surface temperatures, and cloud cover changes worldwide.
- • The Multi-angle Imaging Spectroradiometer (MISR) continues to provide data useful for health researchers studying the effects of particulate matter on populations all over the world.
- • Measurements of Pollution in the Troposphere (MOPITT) is used to study carbon monoxide in the atmosphere, an indicator of pollution concentrations, also a contributor to global health issues.
- • Clouds and Earth’s Radiant Energy System (CERES) provides data on the Earth’s energy budget, helping monitor the incoming and outgoing radiation of Earth.
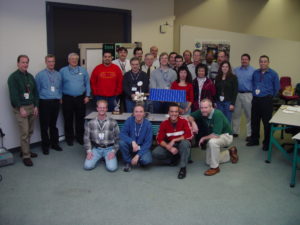
Celebrating the 10th anniversary of Terra in 2009, the flight operations leads and managers posed around a model of Terra.
Terra’s instruments provide one of the longest running satellite climate data records and continue to add valuable data used by researchers and land managers daily. The science teams for each instrument work with the operations and technical teams to ensure that the scientific data provided is accurate and useful to the researchers who access it.
Together these instruments provide both long-term and immediate data about the health of our planet and provide data to help us understand and protect people’s health.
Most recently, for example, scientists analyzed 15 years of pollution data in California, collected by MISR, and discovered that the state’s clean air programs have been successful in reducing particle pollution. More urgently, data from ASTER and MISR provided crucial information about the air quality and land change conditions around Hawaii’s erupting Kilauea volcano, informing critical public health and safety decisions.
The data is free and is valued by people all over the world. Not only can it be accessed daily, there are over 240 direct broadcast sites, where data can be downloaded in near real-time, all over the world. Moyer finds that one of the most rewarding parts of working with Terra is that,” the science data is truly valued by people we don’t even know. People all over the world.”
Learn more about the data Terra has collected over 100,000 orbits from NASA EOSDIS.


 The Measurement of Pollution in the Troposphere (MOPITT) instrument is flying on board NASA’s Terra satellite. It observes Carbon Monoxide (CO) in the troposphere through thermal and near infrared channels. This product was created by the MOPITT Near-Real Time system on Saturday November 10, 2018 and submitted to NASA Worldview. The images clearly show enhanced levels of carbon monoxide associated with the Camp and Woolsey wildfires in northern and southern California. The high levels of carbon monoxide west of Mexico may be an aged part of the Woolsey / Camp fire plumes, based on the location of high carbon monoxide the day before and on the smoke trajectories shown by the Moderate Resolution Imaging Spectroradiometer (MODIS) visible images.