Tag: Water Cycle

Water Cycle News and Events

The American Geophysical Union recently concluded its Fall meeting in San Fransisco, California from December 14 – 18, 2015.  As part of the meeting contributions to science were featured on NASA.gov.  Data from Terra’s instruments played important roles in collecting data to further research in each of these featured areas.  Read the full features from NASA.gov available at the links below.

El Niño

NASA: Observing the 2015 El Niño – The strongest El Niño since 1997 – 1998 is being monitored for the first time by a host of satellites, including Terra. This video (above) features global data sets from Terra’s instruments and their contribution to El Niño research.

How NASA Sees El Niño Effects From Space – The Moderate Imaging Spectroradiometer (MODIS) contributes to data collection on fires and hurricane monitoring

NASA Examines Global Impact of the 2015 El Niño – El Niño research pulls from data from Terra’s 16 years of data collection, monitoring Earth’s systems from Space

Warming Lakes
Study Shows Climate Change Rapidly Warming World’s Lakes – The Advanced Spaceborne Thermal Emission and Reflection Radiometer (ASTER) contributed to this study.

Earthquakes
Studies of Recent and Ancient Nepal Quakes Yield Surprises – The Advanced Spaceborne Thermal Emission and Reflection Radiometer (ASTER) contributed to this study.

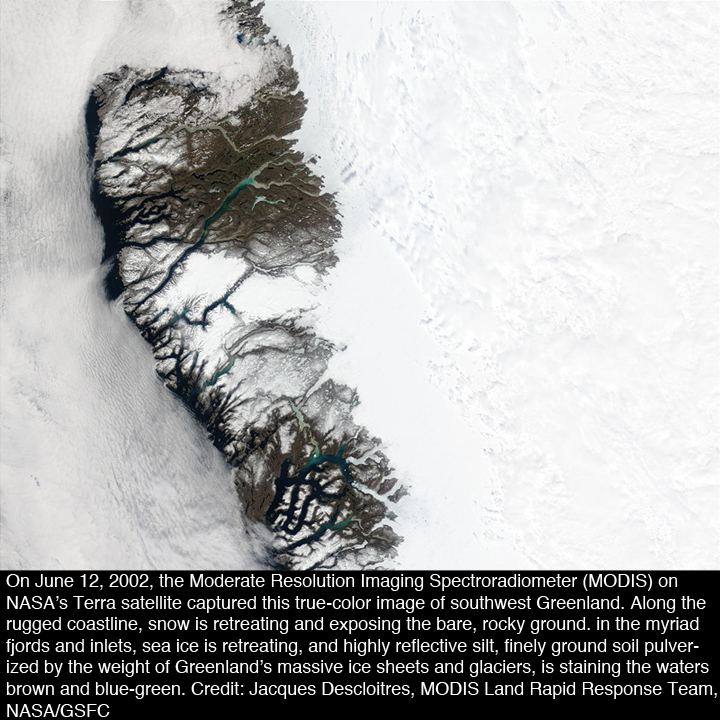
Changes in the MODIS sensor, not dark ice led scientists to incorrectly determine that the Greenland ice Sheet in the Arctic was darkening. These results and others led to improved calibration corrections in the Collection 6 reprocessing of Moderate Imaging Spectroradiometer (MODIS) data.

A recent study suggested that sensor degradation of the MODIS instrument on NASA’s Terra satellite was responsible for the incorrect data. Ironically, the high quality of the MODIS sensor is what initially led Arctic scientists to look for a subtle change in ice brightness. The data collected by MODIS led researchers to consider that the Greenland ice sheet was darkening from an increase in dark aerosol deposition on the snow. However, ground based measurements showed that there had been little if any change in the color of snow.

Ice darkening could have had big implications for climate researchers. Just like black asphalt absorbs radiation from the sun, resulting in a warmer surface temperature, the darkening of the ice sheet could warm the surface temperature around the snow, increasing snowmelt. This could result a shrinking Greenland ice sheet and have implications on sea level rise.

The combination of a well-understood sensor, high-quality analysis of the satellite data, and coordinated measurements at the surface led to the conclusion that a sensor artifact, a change to an image from defects or degradation of optics, was the culprit this time.

Satellites, like many scientific instruments, need to be calibrated to be able to maintain accuracy. If you’ve ever stepped on a scale and gotten a number that was far too high or too low to be accurate, you’ve been a witness to the degradation of an instrument. Scales can be fixed easily by taring, or resetting the instrument to zero when nothing is being weighed.

Fixing satellite sensor degradation, isn’t quite as easy, but is common practice. The complexity of an instrument like MODIS makes the calibration process much more difficult. Often, there are small instrument effects that are not obvious until many years of data from multiple applications indicate an issue. The dark ice example is one such case.

The vigilance of the MODIS scientists and those working with the instrument calibration led to five previous reprocessings with the sixth currently underway.. Each time the data is reprocessed, degradation of the instruments are taken into account and the data is calibrated based on data collected from other sensors on other satellites as well as from data collected on Earth. MODIS is on-board both Terra and Aqua, when data from these sensors don’t match up the data can be corrected based on data gathered on Earth.

While it may be easy to assume that an aging instrument may be less accurate, in reality the longer the data record that it collects, the more accurate the data can be through reprocessing. Just think, if Terra had only lasted it’s six year design life, instead of going on 16, this error in the data may never have been caught and accounted for in newer data collections.

Thus, while the dark ice example could be considered by some as an indication of a flaw in how satellite data are used, it is, in reality, a success story for how a community of scientists working with groups like the MODIS Characterization and Support Team are striving to get to the right answer.

References:

Sun, J., X. Xiong, A. Angal, H. Chen, A. Wu, and X. Geng, (2014) Time-Dependent Response Versus Scan Angle for MODIS Reflective Solar Bands,IEEE Transactions on Geoscience and Remote Sensing, 52 (6), 3159-3174.

Polashenski, C. M., J. E. Dibb, M. G. Flanner, J. Y. Chen, Z. R. Courville, A. M. Lai, J. J. Schauer, M. M. Shafer, and M. Bergin (2015), Neither dust nor black carbon causing apparent albedo decline in Greenland’s dry snow zone: Implications for MODIS C5 surface reflectance, Geophysical Research Letters, 42.

Atmospheric science: Arctic snow is not becoming dirtier. (2015, 29 October). Nature Research Highlights, Accessed November 25, 2015.

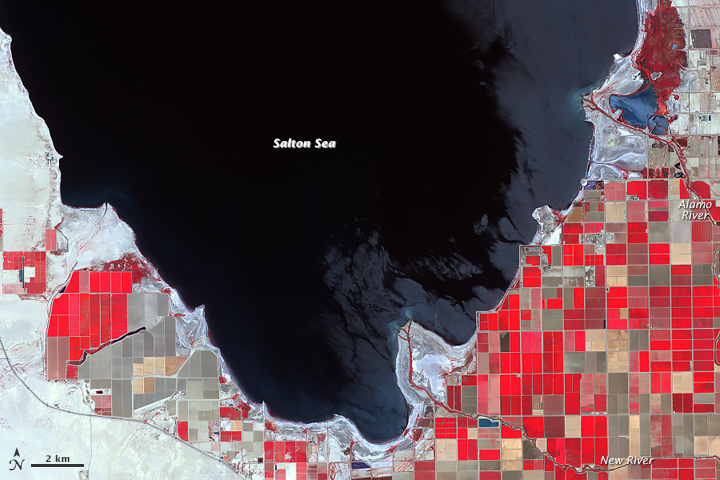
Salton Sea as seen by ASTER

NASA Earth Observatory images by Jesse Allen, using ASTER data from NASA/GSFC/METI/ERSDAC/JAROS, and U.S./Japan ASTER Science Team, and Landsat data from the U.S. Geological Survey.

Fed primarily from agricultural irrigation runoff, the Salton Sea in southern California’s Sonoran Desert has dropped by 8 feet since 1984. While drought in California has contributed to the receding shoreline, water conservation efforts also play a role. The sea may be reduced to two small pools by the 2030s. The Advanced Spaceborne Thermal Emission and Reflection Radiometer (ASTER) on NASA’s Terra satellite captured this image showing the exposed Deltas along its southern shore.

Read the whole article on NASA’s Earth Observatory

earth20150806b-16

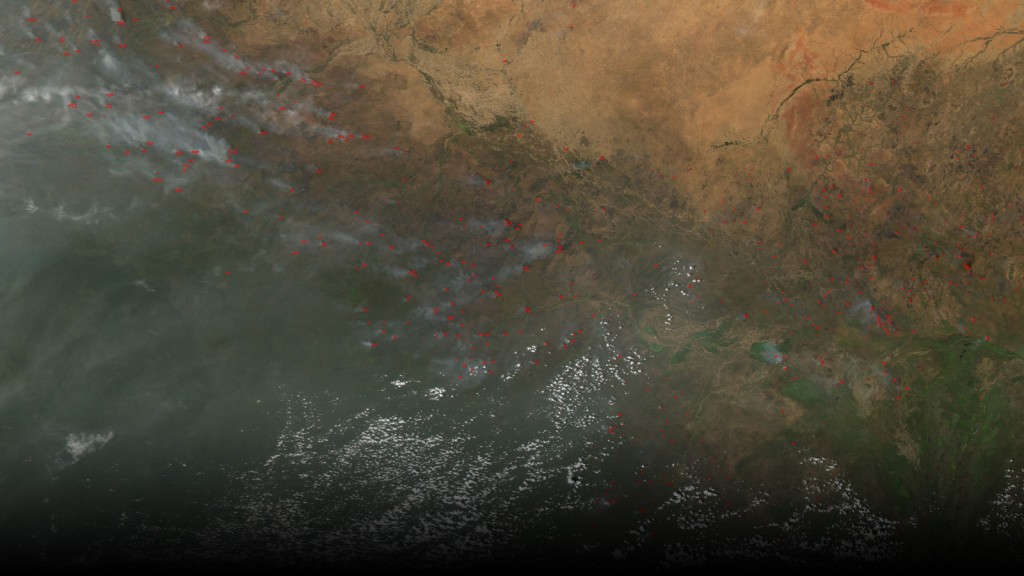
The Moderate Resolution Imaging Spectrometer (MODIS) instrument on NASA’s Aqua satellite captured this image of numerous fires burning in the transition zone between the Sahara Desert to the north and the greener savannas to the south. The image, dating from November 2004, includes parts of Sudan, Chad and other nations to the south and west. Image credit: NASA

A new study is the first to use satellite observations to look at how smoke affects rainfall. Specifically focusing on agricultural fires in North Africa that reduce the amount of rainfall during the dry season.

African agricultural fires, a major source of fires globally, are used to increase agricultural productivity and clear land for farming.  Large plumes are formed by these fires, impacting weather and precipitation patterns, while carrying nutrients to land and ocean regions downwind.

Using satellite data from three NASA satellites from varying passover times along with weather records, Michael Tosca and his colleagues from NASA’s Jet Propulsion Laboratory in Pasadena, California, assessed how microscopic smoke particles affect the formation of clouds and rainfall in Africa, north of the equator and south of the Saharan Desert.

Using images of smokey areas taken by  the Multi-angle Imaging Spectroradiometer instrument (MISR) on-board Terra from 2006 to 2010, Tosca and his colleagues were able to match “each smoky image with a smoke-free scene in statistically identical weather conditions.” From this information they compared the changing cloud cover throughout the day, using data from Tropical Rainfall Measuring Mission (TRMM) and Aqua, which pass over the same region at later times in the day.

Clouds need small airborne particles, aerosols, to act as a nucleus on which water vapor can condense and form clouds. Black carbon, a common aerosols in African fires, absorbs radiation from the sun and heats up the surrounding air.  When a layer of this soot-filled warm air forms, rising air from Earth’s surface is blocked by the warm layer, causing air from Earth’s surface to spread out horizontally. Rain clouds are produced from air moving up in updrafts and then condensing and falling, a process called convection.  When the air cannot penetrate the soot-filled layer, rain cloud formation is suppressed. “The researchers found that less cloud cover built up throughout the day in smoky scenes than in scenes without smoke.”

The NASA press release is available online at: http://www.jpl.nasa.gov/news/news.php?feature=4681

The study is available online at: http://onlinelibrary.wiley.com/doi/10.1002/2015GL065063/full

Read More on NASA’s Earth Observatory

northsea_tmo_2015157

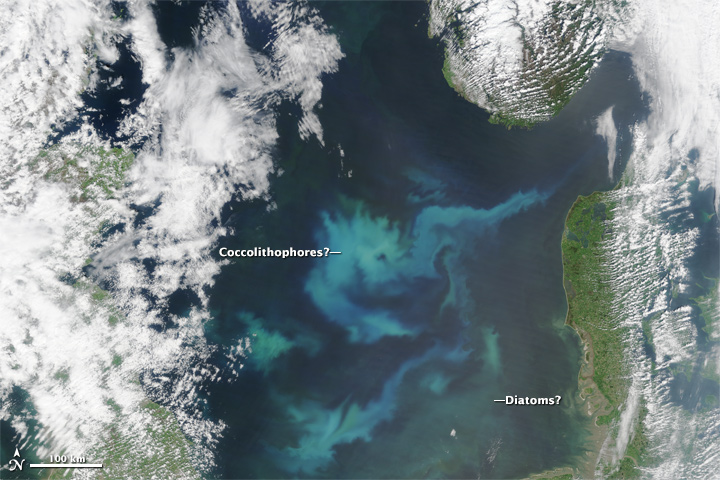
NASA Earth Observatory images by Jesse Allen, using data from the Level 1 and Atmospheres Active Distribution System (LAADS). Caption by Rachel Carlowicz with Mike Carlowicz. Interpretation insight provided by Mike Behrenfeld, Oregon State University, and Jochen Wollschläger, Helmholtz-Zentrum Geesthacht.

Despite its cold waters and harsh winds, the North Sea is a fertile basin for phytoplankton blooms. The drifting, plantlike organisms tend to be most abundant in late spring and early summer due to high levels of nutrients in the water and increasing sunlight. The intense winds blowing over the relatively shallow North Sea causes a lot of vertical and horizontal mixing that brings nutrients to the surface, as does runoff from European rivers.

The first image, acquired on June 6, 2015, by the Moderate Resolution Imaging Spectroradiometer (MODIS) on NASA’s Terra satellite, shows a mass of phytoplankton blooming between Denmark, the United Kingdom, and Germany. The milky, light-colored surface waters are likely filled with coccolithophores, whereas the greener areas are probably rich with diatoms or perhaps dinoflagellates. (It is impossible to know for sure without water samples.) Read more