Month: October 2018

TAMPA BAY Landsat 2000 A satellite view of Florida’s Gulf Coast around St. Petersburg that since this summer has experienced a dangerous red tide. Satellite data from NASA and the European Space Agency were used to develop the new red tide health alert system. Credits: NASA

This summer and early fall, beachgoers and residents along Florida’s central Gulf Coast endured an unpleasant and, at worst, debilitating aquatic annoyance: a dangerous red tide caused by the harmful algae Karenia brevis. Toxins released from this year’s high concentrations of the algae killed countless fish and marine mammals. As those toxins became airborne, they brought breathing difficulties to beach-goers – especially those with severe allergies and asthma.

Starting in October, people looking to avoid the hazardous effects of toxic red tides around St. Petersburg and Pinellas County have a new smartphone-based pilot information resource updated several times a day to help them know the risks before they head to the beach.

“This new 24-hour Experimental Red Tide Respiratory Forecast lets people see which beaches might be impacted by red tide, allowing them to plan their beach activities,” said Barbara Kirkpatrick, executive director of the Gulf of Mexico Coastal Ocean Observing System (GCOOS). “They can use this tool the same way they use other weather reports.”

This new forecast, updated every three hours, was developed by NOAA’s National Centers for Coastal Ocean Science in partnership with NASA, GCOOS, the Florida Fish and Wildlife Conservation Commission, and Pinellas County Environmental Management. It builds on NOAA’s Harmful Algal Bloom Forecast System and the Near Real-Time Integrated Red Tide Information System from the University of South Florida, both of which use NASA satellite data.
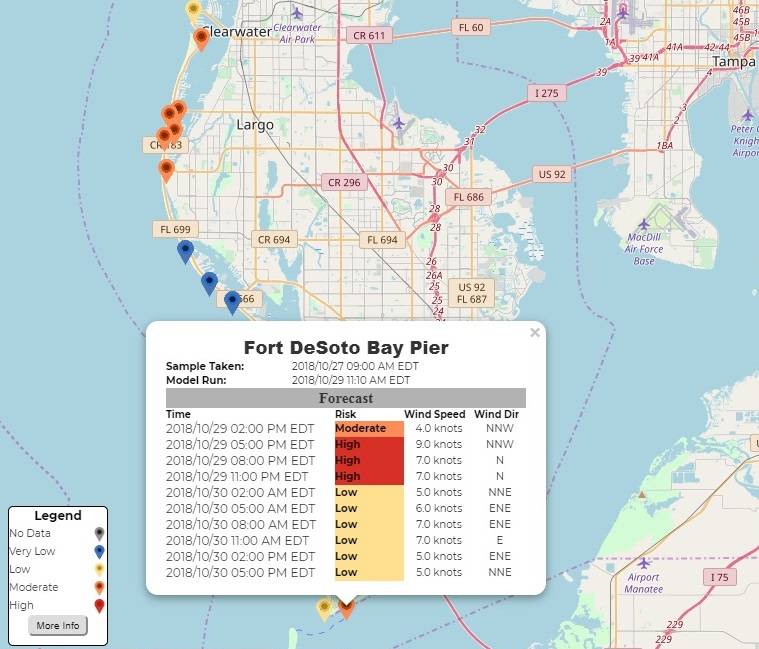
People looking to avoid the hazardous effects of toxic red tides in Pinellas County, Florida, now have a smartphone-based information resource updated several times a day to help them know the risks before they head to the beach. Credits: GCOOS

To understand the extent and evolution of fast-changing blooms around the world – a key research objective of NASA’s Earth science program – satellite observations are essential. Data from NASA’s Terra and Aqua spacecraft and the European Space Agency’s Sentinel-3 satellites were used to develop the system. These satellites provide data that guide ground sampling locations, which are fundamental to identifying the toxic organisms, and help fill in any gaps in sampling. Pinellas County conducts a daily direct counting of Karenia brevis. The county is also collecting data using a new tool called HABscope, developed by GCOOS researcher Robert Currier.

HABscope is a smartphone app that was the product of a collaboration between NASA’s Applied Sciences Program and several partner institutions. Trained water samplers collect video of water using microscopes attached to their smartphones. The videos are then uploaded to a cloud-based server and are automatically analyzed by computer software developed by GCOOS that identifies and counts the number of Karenia brevis cells in the water sample.

This experimental forecast is being tested in Pinellas County because it has rapidly developed a robust data collection system for red tide cell counts. This cell count data, combined with wind forecast information, helps verify the beach-level forecast models. Looking ahead, HABscope data may feed directly into the experimental system and extend to beaches in other counties.

“Now, thanks to the water testing conducted by Pinellas County, we’re able to refine our forecasts and offer predictions on a beach-by-beach basis,” said NOAA National Centers for Coastal Ocean Science oceanographer Richard Stumpf. “This forecast is the first step toward reducing the health and economic impacts of red tides for coastal communities. No one should get sick from a day at the beach.”

Last Updated: Oct. 30, 2018
https://www.nasa.gov/feature/space-views-aid-florida-red-tide-health-alerts-1 
Editor: Thalia Patrinos

Atlantic’s Hurricane Oscar’s Water Vapor Measured by NASA’s Terra Satellite
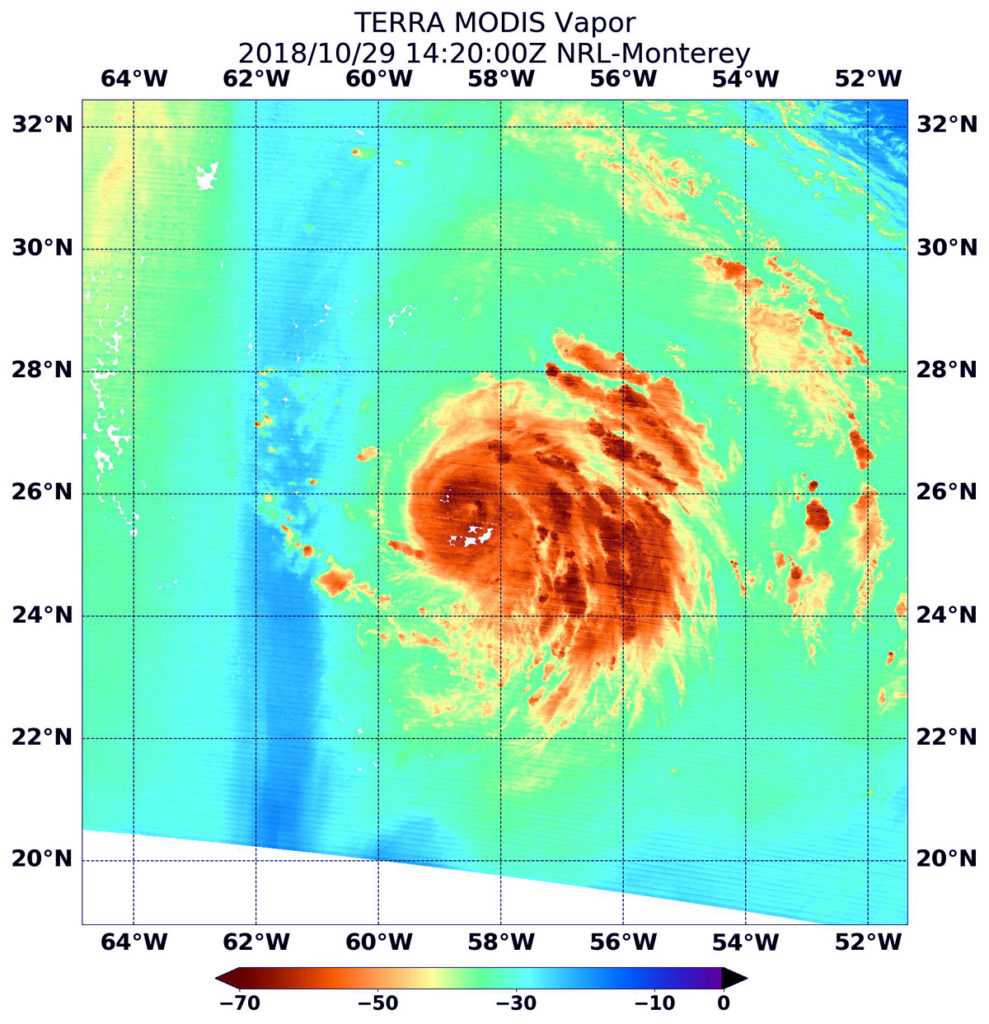
When NASA’s Terra satellite passed over the Central Atlantic Ocean on Oct. 16 the MODIS instrument aboard analyzed water vapor within Tropical Storm Oscar.

Terra image of Oscar NASA’s Terra satellite passed over Hurricane Oscar in the Atlantic Ocean On Oct. 29 at 10:20 a.m. EDT (1420). The MODIS instrument showed highest concentrations of water vapor (brown) and coldest cloud top temperatures were around the center (over water) and in the eastern quadrant. Credits: NASA/NRL

Oscar formed as a subtropical storm in the central North Atlantic Ocean on Friday, Oct. 26 at 11 p.m. EDT. Over the weekend of Oct. 27 and 28, Oscar took on tropical characteristics and strengthened into a hurricane.

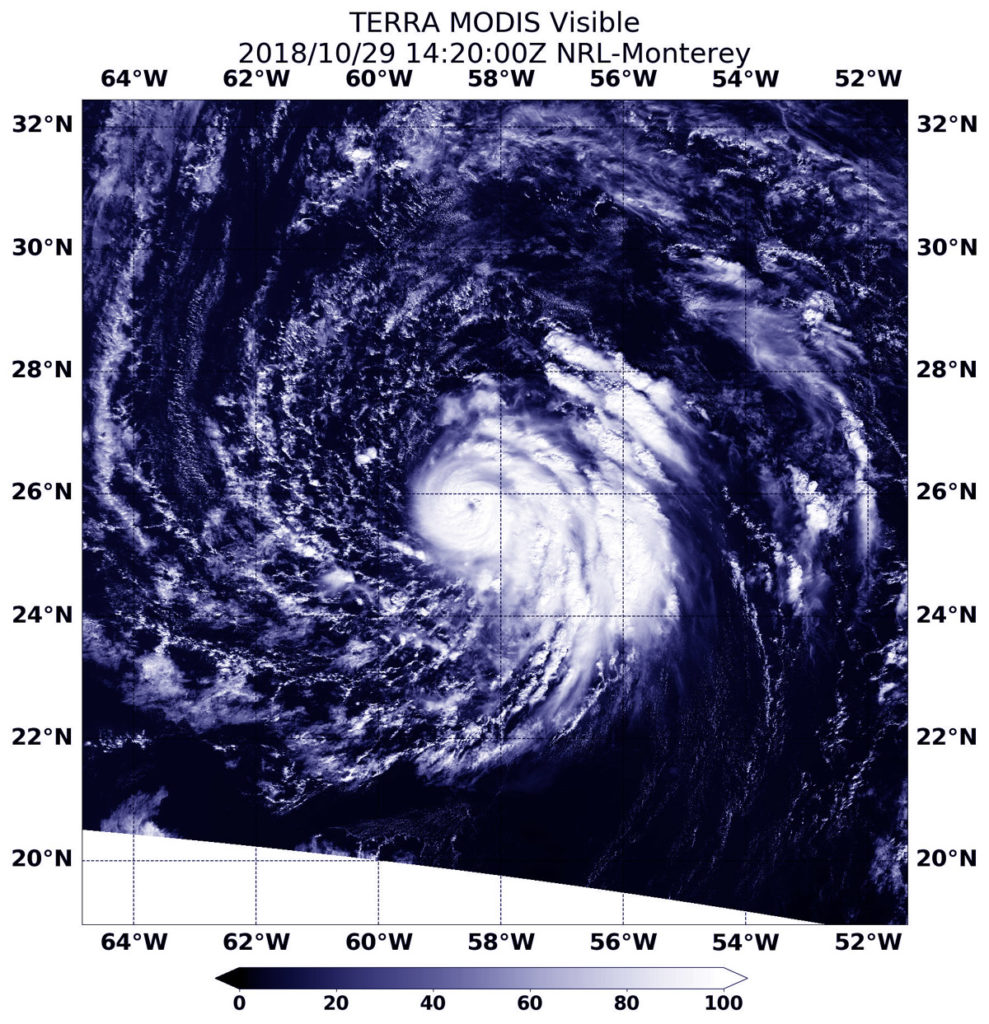
On Oct. 29 at 10:20 a.m. EDT (1420) NASA’s Terra satellite passed over Oscar and provided visible and water vapor imagery of the newest Atlantic Hurricane.

Water vapor analysis of tropical cyclones tells forecasters how much potential a storm has to develop and shows where the heaviest rainfall may be found. Water vapor releases latent heat as it condenses into liquid. That liquid becomes clouds and thunderstorms that make up a tropical cyclone. Temperature is important when trying to understand how strong storms can be. The higher the cloud tops, the colder and the stronger they are.

Terra image of Oscar NASA’s Terra satellite passed over Hurricane Oscar in the Atlantic Ocean On Oct. 29 at 10:20 a.m. EDT (1420). The MODIS instrument showed a clear eye surrounded by powerful thunderstorms. Fragmented bands of thunderstorms in the eastern quadrant. Credits: NASA/NRL

The Moderate Resolution Imaging Spectroradiometer or MODIS instrument aboard Terra gathered water vapor content and temperature information. The MODIS image showed highest concentrations of water vapor and coldest cloud top temperatures circled the center and extended east. MODIS saw coldest cloud top temperatures were as cold as minus 70 degrees Fahrenheit (minus 56.6 degrees Celsius) in those areas. Storms with cloud top temperatures that cold have the capability to produce heavy rainfall.

Visible imagery from MODIS showed a clear eye surrounded by powerful thunderstorms. Fragmented bands of thunderstorms in the eastern quadrant.

The National Hurricane Center said “Oscar’s convective cloud pattern has continued to improve since the previous advisory, with a small, cloud-filled eye now apparent in visible satellite imagery and also in a recent microwave pass. In addition, cirrus outflow has been expanding in all quadrants, especially in the eastern semicircle.”

The National Hurricane Center or NHC said at 11 a.m. EDT (1500 UTC) the eye of Hurricane Oscar was located near latitude 25.8 degrees north and longitude 58.4 degrees west. That’s about 590 miles (955 km) southeast of Bermuda. Oscar is moving toward the west-northwest near 7 mph (11 kph). A turn toward the northwest at a slower forward speed is expected later today, followed by a motion toward the north tonight. Maximum sustained winds have increased to near 85 mph (140 kph) with higher gusts. Additional strengthening is forecast through Tuesday, followed by gradual weakening thereafter. The estimated minimum central pressure is 981 millibars.

On Tuesday, Oct. 30, Oscar is forecast to begin moving toward the north-northeast with an increase in forward speed. The hurricane is then expected to accelerate quickly toward the northeast through the middle of the week.

For updated forecasts, visit: www.nhc.noaa.gov.

By Rob Gutro
NASA’s Goddard Space Flight Center

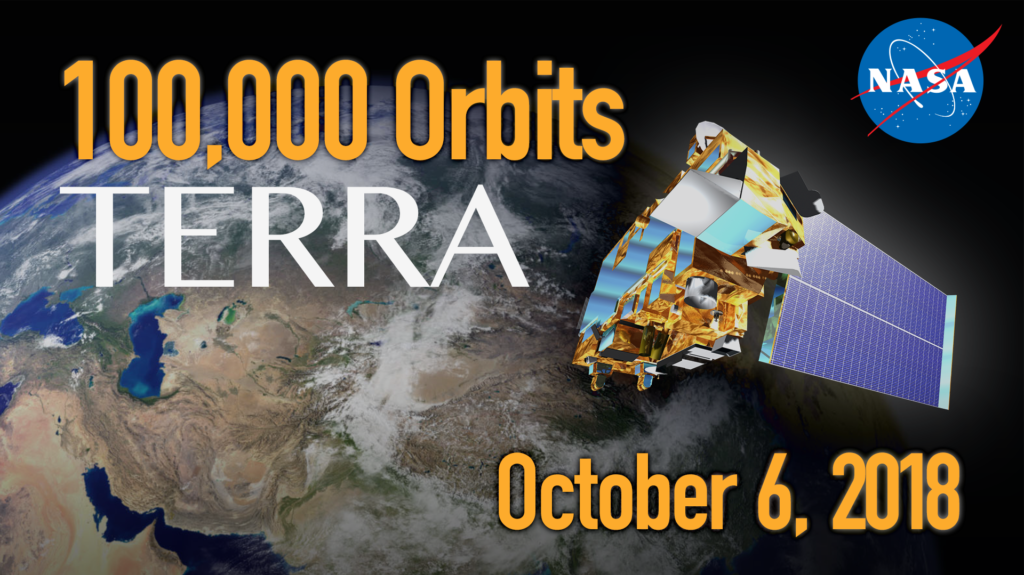
More than 400 miles above Earth, a satellite the size of a school bus is earning its frequent flyer miles. On October 6, 2018 Terra completed 100,000 orbits around Earth. But just as a plane can’t fly without a crew, the Terra satellite never could have reached this milestone without decades of dedicated work by talented engineers and scientists.
Completing over 2.5 billion miles of flight around Earth over almost 19 years does not happen unless a satellite is designed, constructed, and operated with the greatest care. “You have multiple, different aspects in the team to make it work,” says the Deputy Project Manager – Technical at NASA’s Goddard Space Flight Center, Eric Moyer.

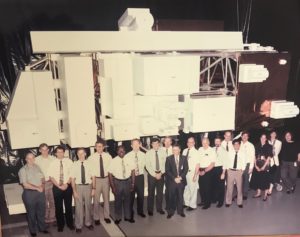
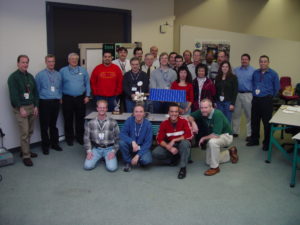
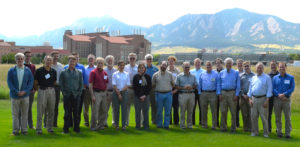
The Terra working group, including representatives from science teams, instruments teams, and flight operations teams met in Boulder Colorado in 2015.

“You have flight operations, subsystem engineers, subject matter experts, the instrument teams, and the science teams for each of the instruments. Overall it all has to be coordinated, so that one activity doesn’t negatively impact another instrument,” explains Moyer, who worked on Terra during construction and continues to be involved with its operations today.

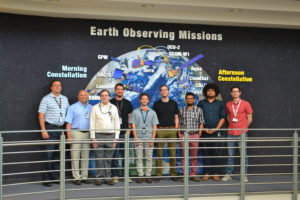
The offline Terra mission operations team stands in front of an image of the fleet of NASA Earth Observing Satellites

Terra joins a handful of satellites to mark this orbit milestone, including the International Space Station, Landsat 5 and Landsat 7. Terra, which launched December 18, 1999, is still going strong and is projected to continue operation into the 2020s.

Dimitrios Mantziaras, Terra Mission Director at NASA’s Goddard Space Flight Center, sums up what it takes: “A well-built spacecraft, talented people running it and making great science products, with lots of people using the data, that’s what has kept it running all these years.”

Designing a Pioneer

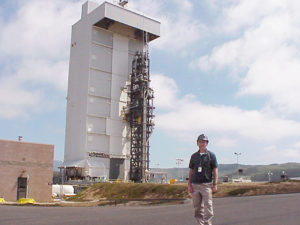
Dick Quinn stands in front of launch platform.

Dick Quinn stands in front of Terra on its launch vehicle, an Atlas IIAS rocket. Terra launched December 18, 1999. Image courtesy of Dick Quinn

Terra was unique from the beginning. It was the first satellite to study Earth system science, looking at land, water and the atmosphere. Unlike many previous, smaller satellites, Terra didn’t have a previously launched satellite platform to build upon. It had to be designed from scratch.

“Unlike the Landsat mission, that continues to improve upon its original design, nothing like Terra had ever been built,” says Dick Quinn, Terra’s spacecraft manufacturing representative from Lockheed Martin, who still works part-time with the team responsible for Terra’s continued flight.

Terra was meant to be the first in a series of satellites, known as AM-1, 2, and 3, each with a design life of about 5 years. Instead, they ended up designing a satellite that lasted longer than the combined design life of 3 generations of Terra satellites.

Constructing and Operating a Solid Satellite 

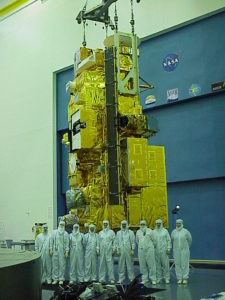
Terra’s test team stands in the clean room in front of Terra during Terra’s construction and testing phase.

The built-in redundancies and flexibility of the satellite were put to the test in 2009, when a micrometeoroid struck a power cell, degrading the thermal control for the battery. “We had to change the way we manage the battery to keep it operating efficiently and keep it at the right temperature.” says Jason Hendrickson, Terra flight systems manager at Goddard Space Flight Center, who joined the team in 2013. To do this, the team used the charge and discharge cycle of the battery itself to generate the heat necessary to keep the battery operating. They have been fine tuning this cycle ever since.

Terra engineers and scientists continually plan for worst-case scenarios, anticipating problems that may never develop. “We are always thinking, if this were to fail, how are we going to respond?” says, Hendrickson. “You can’t just go to the garage and swap out parts.”

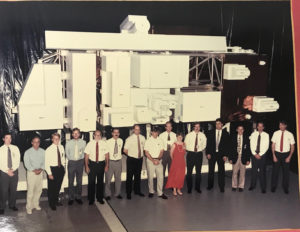
The NASA team of scientists, engineers and designers pose for a group photo in front of a true-to-size model of Terra.

Members of the design team stand in front of a model of Terra in the mid 1990s.

Not only does the team plan for many possible scenarios, but it also looks back at the response and figures out how it can be improved.

However, most of the time, they don’t have to wait for a system failure to practice contingency plans.  For example, in 2017 the team executed a lunar deep space calibration maneuver that turned the satellite to look at deep space, instead of at Earth. “We had to take into account what would happen if the computer were to fail when we were pointed at deep space,” says Hendrickson.

The mission operations team executes the Lunar Deep Space Calibration Maneuver in 2017. Image courtesy of Kurt Thome.

The calibration maneuver was executed successfully and the team never had to conduct their contingency plan. The science gained from calibrating Terra’s data against deep space, allowed the scientists to improve the data collected by the Advanced Spaceborne Thermal Emission and Reflection Radiometer (ASTER). ASTER is one of five instruments on Terra. It monitors volcanic eruptions and provides high resolution imagery of locations all over the world.

In addition to ASTER, the instruments on Terra are:

  • The Moderate Imaging Spectroradiometer (MODIS) protects people’s lives and property through operations like MODIS rapid response, which monitors wildfires daily. Additionally, MODIS collects data on land cover, land and sea surface temperatures, and cloud cover changes worldwide.
  • The Multi-angle Imaging Spectroradiometer (MISR) continues to provide data useful for health researchers studying the effects of particulate matter on populations all over the world.
  • Measurements of Pollution in the Troposphere (MOPITT) is used to study carbon monoxide in the atmosphere, an indicator of pollution concentrations, also a contributor to global health issues.
  • Clouds and Earth’s Radiant Energy System (CERES) provides data on the Earth’s energy budget, helping monitor the incoming and outgoing radiation of Earth.

Celebrating the 10th anniversary of Terra in 2009, the flight operations leads and managers posed around a model of Terra.

Terra’s instruments provide one of the longest running satellite climate data records and continue to add valuable data used by researchers and land managers daily. The science teams for each instrument work with the operations and technical teams to ensure that the scientific data provided is accurate and useful to the researchers who access it.

Together these instruments provide both long-term and immediate data about the health of our planet and provide data to help us understand and protect people’s health.

Most recently, for example, scientists analyzed 15 years of pollution data in California, collected by MISR, and discovered that the state’s clean air programs have been successful in reducing particle pollution. More urgently, data from ASTER and MISR provided crucial information about the air quality and land change conditions around Hawaii’s erupting Kilauea volcano, informing critical public health and safety decisions.

The data is free and is valued by people all over the world. Not only can it be accessed daily, there are over 240 direct broadcast sites, where data can be downloaded in near real-time, all over the world. Moyer finds that one of the most rewarding parts of working with Terra is that,” the science data is truly valued by people we don’t even know. People all over the world.”

Learn more about the data Terra has collected over 100,000 orbits from NASA EOSDIS.