Month: May 2012

Dr. Helen Worden is the Project Scientist in the Atmospheric Chemistry Division at the National Center for Atmospheric Research.  She is one of the leading experts in the use of MOPITT and Tropospheric Emissions Spectrometer to study carbon monoxide (CO) and other gases in the atmosphere.

What do you study?

HW: I study trace gases in the lowest part of the atmosphere, including air pollutants like ozone (O3) and carbon monoxide (CO), using satellite remote sensing.

MOPITT is one of the instruments you use to study carbon monoxide (CO), can you tell us some of the observations you have observed so far?

HW: I have used MOPITT CO data to follow the global transport of pollution from major urban areas and from large fires. We also use MOPITT data to estimate the sources and strengths of CO emissions.

Recently, I have been using MOPITT data, along with a regional model for weather and chemistry (WRF-Chem) to quantify the reduction in CO emissions due to the traffic restrictions that were imposed during the Beijing 2008 Olympics to improve air quality. Because we know the ratio of CO to CO2 for emissions from fossil fuels in China, we can also estimate the reduction in CO2 for the Beijing Olympics.

You study carbon dioxide (CO2) as well, which is also a trace carbon gas that exists in the lower atmosphere.  Can you explain how it’s different from CO?

HW: CO and CO2 are both emitted from burning fossil fuels and wildfires, but CO2 is a strong greenhouse gas and also has a much longer lifetime in the atmosphere (hundreds of years) compared to CO (less than a few months).

What roles do CO play in the Earth System Science?

HW: CO is a pollutant near the surface, but at normal levels, around 100 ppb (parts per billion), CO is not harmful. (CO is deadly at concentrations larger than 400 parts per million).

Although CO itself does not have a significant greenhouse effect, it converts chemically to ozone, methane and carbon dioxide, which are major greenhouse gases. So, the emissions of CO are considered important to climate change.

Since it has a medium lifetime in the atmosphere (longer than a day, but not more than a few months), CO can be used to track pollution events and how they are transported across the globe. These events, such as large fires, have higher concentrations of CO that are easily measured over atmospheric background levels.

Are efforts to decrease CO emissions working?

HW: Yes, especially with the improved emissions in newer cars.

Finally, what you do is very technical”¦, what inspired you to go into this field?

HW: Understanding our atmosphere is very challenging, but necessary if we want to make informed decisions for our future. I also find remote sensing really interesting and at times, very exciting, like when we launch a satellite and we get a whole new image of our world.

Over half of the US and one third of world population live along the coastlines.  In the US alone, from 2000-2010, 9 billion damages incurred from floods.  Dr. Robert  Brakenridge is at the forefront of flood studies by using advanced satellite remote sensing and geographic information science technologies.  He heads the Dartmouth Flood Observatory, which contains comprehensive database on floods and is, frequently, used by other flood researchers. 

You oversee a team of researchers who use Terra instruments to study floods.  Can you discuss how and why Terra instruments are used to study floods?

BB: Terra’s always-on sensor (MODIS) provides unprecedented imaging of the Earth’s changing surface waters on a near-daily basis, worldwide, at spatial resolutions of as good as 250 m. This capability now allows inundation from large floods to be to routinely mapped, in near-real time, and recorded for posterity. The latter task provides very useful information for future flood risk evaluation.  Floods cover large regions, so that MODIS’s big image “œfootprint” is a major advantage. Also aboard Terra, the ASTER sensor, then can provide as well the detailed mapping of smaller areas of land as much higher spatial resolution.

Dartmouth Flood Observatory contains a database that stores flood attributes.  Can you discuss some of these attributes and discuss how they may be used for modeling purpose?

BB: One route towards better flood prediction is to simply obtain a better record of what is occurring. The Flood Observatory does this, in part, by remote sensing. Again the temporal and geographic sampling of MODIS allows us to track floods worldwide, year after year. Patterns then emerge: which portions of the monsoonal regions flood first; which areas are predictably affected by snowmelt in the spring, and how variable are the floods, each year. We can now compare the number of floods, and their locations, and their intensities, this year, with past years.  Previously, one could do this, for some nations, using point-site streamflow records (which only indirectly indicate actual overbank flooding). Now we can do this directly, by imaging and mapping and preserving the maps of actual flooding.

What roles do floods play in Earth System Science?

BB: Floods are a component of the global water cycle, and along some rivers a large portion of total annual runoff is transmitted during these time-restricted events.   Ground-based measurement stations are often destroyed during large floods, which are the events most easily well-measured from space. Floods also transport major quantities of sediment, and including materials such as organic and inorganic carbon that are important in understanding the global carbon cycle.  Many other practical applications are there to be developed:  transport of heavy metal pollutants, absorbed onto sedimentary particles, for example: where do these transported and deposited pollutants cause human health issues? Measuring the fluxes and pathways of flood water is indeed best performed from orbital sensors.

What are some long term global effects of flooding?

BB: There are major humanitarian and economic issues every year from flooding, worldwide. Pakistan is still recovering from the catastrophic flood along the Indus River (2010), the NE USA has, of this writing, been severely affected by tropical storm Irene flooding (especially the New England states); this past winter much of E. Australia was experiencing unprecedented flooding over vast areas, which we could monitor and map each day via Terra MODIS.

Flooding occurs on every continent, but most fatal floods occur in Asia, Southeast Asia, Africa, Central American and the Caribbean according to one of the papers you co-authored.  Is there a reason why flooding occurs more frequently in developing nations?

BB: Flooding causes enormous damage in the more-developed nations, and it can be lethal; but it is in nations such as Pakistan, India, China, Bangladesh, Mexico, the Philippines, sub-Saharan African, and the nations of Indochina where fatalities are most abundant.  In part, this is due to lack of warning systems (orbital sensors have a role to play in improving this); there may also be lack of basic information as to what lands are being flooded (here the Flood Observatory’s near-real time flood mapping efforts are important); fatalities are also due to high population densities and inadequate control structures and drainage (in both the cities and the rural areas). In some cases, development assistance has exacerbated the damage, by providing a false sense of protection and fostering more development behind supposedly protective levees.

Why is it important to study floods?

BB: Floods are an integral part of floodplain ecosystems, and much of the global human population resides on floodplains. We live close to rivers, and we misunderstand their processes at our peril!  Many scientists who study rivers are urging different sorts of engineering responses to floods and flood hazard:  approaches that work with the rivers, and their natural processes, are more likely to be successful in the long term. The recent planned avulsion (diversion) of the Mississippi River to a pre-planned spillway is a good example of how setting aside some lands for temporary use by a river in major flood can help save urban properties downstream.

How did you get interested in the study of floods?

BB: In 1993, during the Great Flood of the Upper Mississippi River, I flew “œunderflew” a radar satellite imaging of this flooding (ERS-1, an ESA satellite). My colleague Jim Knox and I flew in a small plane at about 900 ft along the flooded valley while this satellite was acquiring images, which we then used to map the flood.  I interrupted my other work to do this, but found the topic of such inherent interest that my work has focused on flood remote sensing ever since then.

Dr. Larry Di Girolamo is a Professor and the Daniel Shapiro Professorial Scholar in the Department of Atmospheric Sciences at the University of Illinois at Urbana-Champaign.  He uses data collected from ASTER, MISR, and MODIS to study weather, aerosol and cloud properties.  More recently, he co-authored a paper that reveals high concentration of aerosol over the Indo-Gangetic Basin region in India from data collected by MISR.  In addition to being a prolific author, he also teaches courses in meteorology and satellite remote sensing.  He is frequently ranked as one of excellent teachers at the University.

What do you study?

LDG: I study cloud, aerosol and radiation processes in our atmosphere that occur over a wide range of scales. At larger scales, say from the size of a house to the size of the globe, satellites offer the only viable way to routinely collect observations of cloud and aerosol properties over our planet. And since meteorological satellites only measure electromagnetic radiation incident on its detectors, I spend a lot of my time studying how to convert these radiation measurements into meaningful information on cloud and aerosol.

The term weather and climate are often used interchangeably; can you discuss the difference between the two?

LDG: Weather is the condition of the atmosphere at a given location and time. The condition of the atmosphere is often described in terms of such variables as temperature, pressure, humidity, wind, visibility, cloudiness, and precipitation.

Climate is a statistical summary of the weather at a given location over a long period of time, several decades for example. The statistical summary is often conveyed to the public in terms of the average weather and the weather extremes at a given location over the historic data record.

As an example of weather: on August 25, 2011, at 5:00 pm over Urbana, Illinois, it was sunny with a temperature of 28°C and a relative humidity of 49%.

As an example of climate: the average temperature for the month of January in Chicago, Illinois, is -5.9°C.

You use multiple Terra instruments (ASTER, MISR, and MODIS) to study cloud properties such as cloud-top-heights.  Why is it important to study clouds?

LDG: Sunlight is our ultimate source of energy. Clouds, which cover about 68% of the globe, regulate the incident amount of sunlight reaching the surface and they contribute to the greenhouse effect more than any other atmospheric variable. Clouds are also an important component of the hydrological cycle, coupling the atmosphere and the ground through precipitation. During the life cycle of a cloud, there’s a large exchange of latent heat (the energy associated with a phase change in water) between the cloud and the environment. This exchange of latent heat impacts the dynamics of the atmosphere, hence the evolution of the weather. So clouds play a significant role in weather and climate that impacts our lives.

Given the significant role of clouds, it’s important that we understand their properties, how their properties evolve in space and time, and how to properly treat them within our computer models that make weather and climate predictions. When it comes to numerical weather predictions, the microphysical aspect of cloud and precipitation and associated exchanges of latent heat are leading sources of uncertainty. In climate predictions, the role of clouds remain a leading source of uncertainty for any given anthropogenic change scenario. If we want to reduce our uncertainty in weather and climate predictions, we need to continue to study clouds. Terra provides a great suite of instruments for studying clouds.

You also use MISR to study aerosols.  What role do they play in weather?
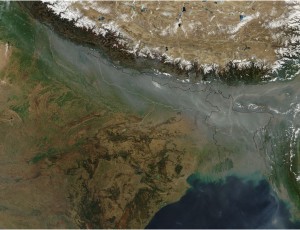
Gray haze builds along the front of the Himalaya Mountains in northern India in this MISR image.

LDG: To a lesser extent than clouds, aerosols also regulate the amount of sunlight reaching the ground. For example, in the absence of fog, it is the variability in aerosols that contribute the most to the variability in visibility. But perhaps more importantly in terms of their role in weather, is the fact that water vapor condenses onto aerosols to form clouds at a relative humidity near 100%. Without aerosols, hundreds of percent relative humidity is required for water vapor to condense to form clouds. So without aerosols, there would be very few clouds. Fortunately, there are plenty of aerosols provided by nature. The properties of these aerosols can modulate the properties of clouds, including the microphysical properties of clouds, rain production, cloud cover, and cloud lifetimes. There are also cloud processes that modify aerosol properties. This interaction between cloud and aerosol properties is currently a hot topic in atmospheric science research, and Terra data continues to contribute greatly toward our understanding of this interaction.

Another role that aerosols play is in the quality of air that we breathe. The acute and chronic health impacts, predominately to our respiratory and cardiovascular systems, from short and long-term exposure to aerosols are now well established. The World Health Organization has established air quality guidelines, which includes exposure levels in terms of the size range of airborne particulate matter. The particle size is a determinant in where and how it gets deposited in the respiratory system.   Since most humans live on land, observing aerosols over land is of primary importance. Before the launch of MISR, there were no good, quantitative satellite observations of aerosol properties over land. MISR was designed to provide information on the size and shapes of aerosols over water and land. With more than a decade of MISR data, we are beginning to see from space how the aerosol field changes due to natural events and human activities.

As you know Terra has five instruments that monitor various components that make up the Earth System.  Can you explain the dynamics among weather, land and oceans?

LDG: There are too many details to answer this question properly. So I can only answer in a very generic sense. Basically, the atmosphere, land, and oceans store and exchange heat and momentum. They also exchange moisture, and many types of gases and aerosols.  Ultimately, it is the uneven distribution of these quantities over the globe that forces the exchange of these quantities between land, ocean and atmosphere. The dynamics involved in this exchange manifest themselves to us in terms of weather, ocean currents, a changing biosphere (e.g., desertification), etc.  Terra provides a broad range of measurements necessary to make advancements in our understanding on how these exchanges take place from regional to global scales.

And, finally how did you get interested in science and, then, decided to study weather?

LDG: NASA’s Viking mission beamed back spectacular true color images of Mars. I was a kid when I first looked at those images – it completely reshaped and redirected my thinking. The visual cue of true color images from another planet was absolutely awesome. I was also a fan of Star Trek. So I enrolled as an undergraduate student in Astrophysics and later as a graduate student in Atmospheric Sciences. I became aware of environmental problems we faced on our planet and the challenges in observing Earth from space. I wanted to help, but I still wanted to work from the vantage point of space. I was fortunate to be part of the Terra mission. When MISR and MODIS beamed back wide-swath true-color images of Earth, I got that same awesome feeling as when I first looked at Viking images. And when we fused the multiple-views from MISR to produce 3-D images”¦ it was like floating in space!