Image from TERRA
Tue, 20 Sep 2022 10:30 EDT

Water departments in the West are using maps and models originally created by a NASA team to help track water.

Image from TERRA
Thu, 15 Sep 2022 10:00 EDT

NASA and Google broadened an existing partnership to help local governments improve their monitoring and prediction of air quality for better decision making.

Image from TERRA
Mon, 11 Jul 2022 09:30 EDT

Ozone pollution assessments made for the Great Lakes region now include NASA satellite and other near-real time Earth observations.

Tag: Atmosphere

Atmosphere News and Events

Dr. Helen Worden

We recently featured several important scientists who use Terra data in their research, including Dr. Rebecca Buchholz (check out the post here) who works with Dr. Helen Worden, the US Principal Investigator for the Measurements of Pollution in the Troposphere (MOPITT) sensor to evaluate spatial patterns of air pollution critical for natural hazard response and public health planning.

MOPITT data are used to derive carbon monoxide concentrations such as those released from burning vegetation, coal, and other combustible plant material. MOPITT carbon monoxide measurements are used to determine where wildfires are burning and to infer the presence of other air pollutants, too. After analyzing over 15 years of data, the MOPITT team found that overall carbon monoxide levels have decreased globally over the past decade, but with varying amounts related to regional land use differences. Additionally, the team also discovered that an increase in new seasonal peaks of air pollution– especially from summer wildfires burning in the American Pacific Northwest – contribute to increased health risks “downwind” of these fires – even impacting places as far away as Colorado!  Find out more about this research in this NCAR/UCAR News article and this Earth Observatory Image of the Day!

For more on Dr. Helen Worden’s research, check out her bio here as well as her 2012 interview by our own Tassia Owens!

New evidence shows that California’s clean air programs that reduce particle pollution in California are working.

Scientists from Emory University, NASA’s Jet Propulsion Laboratory, and the California Air Resources Board analyzed the 15-year trend of fine particle pollution based on satellite data from Terra’s Multi-angle Imaging SpectroRadiometer (MISR) instrument. This type of pollution, known as PM2.5 (less than 2.5 microns in diameter) accounts for the greatest percentage of health impacts attributable to air pollution in California.

The study was recently published in the journal “Atmospheric Environment” is the first to evaluate long-term changes in major PM2.5 components using spatially comprehensive satellite data, according the the California Air Resources Board.

Read the press release from the California Air Resources Board.

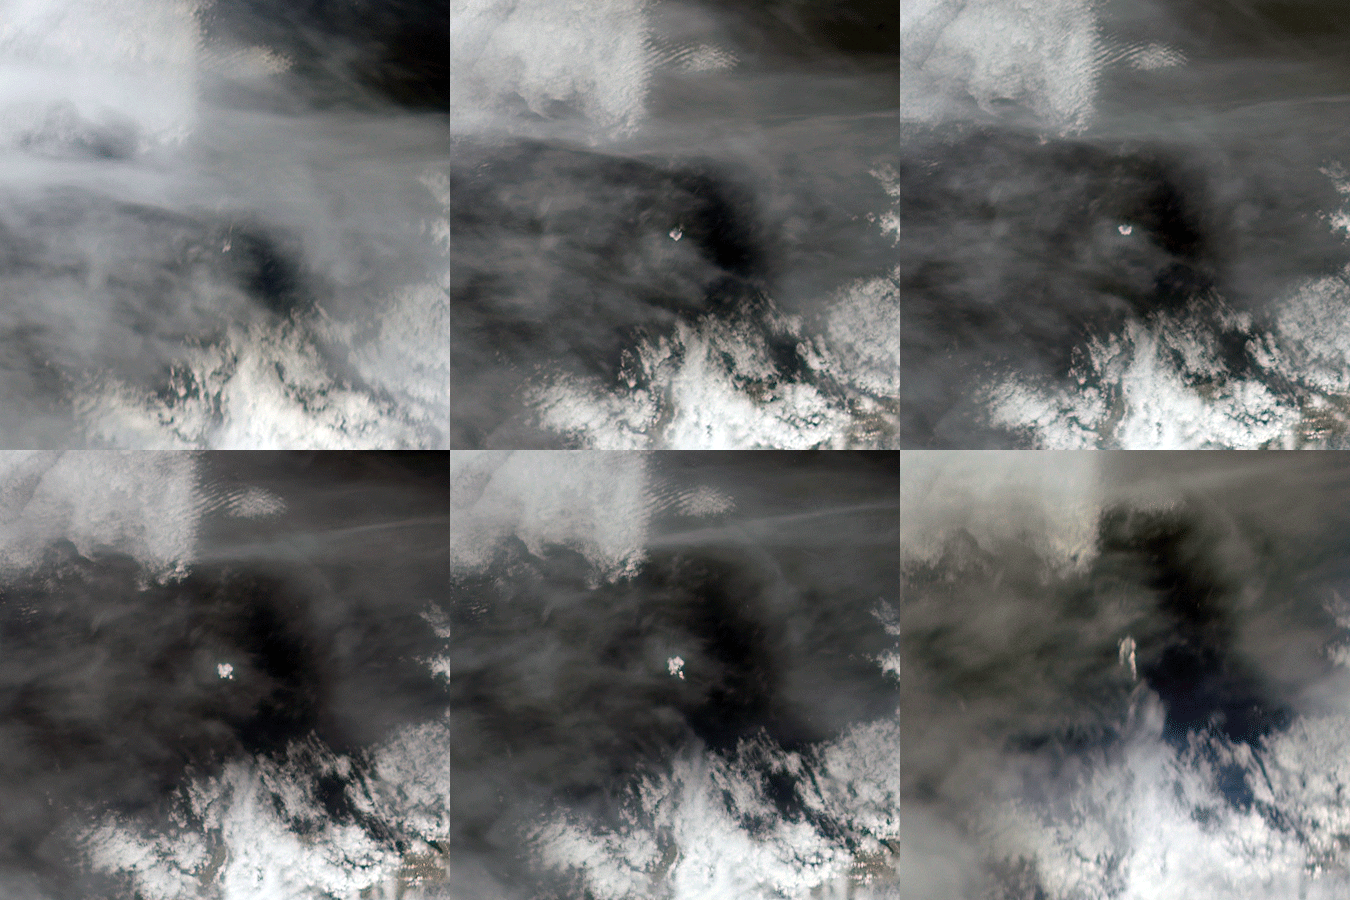
The tiny Aleutian island of Bogoslof in Alaska, erupting regularly since December 2016, produced fresh activity on Sunday, May 28, 2017. Bogoslof is a stratovolcano fueled by the subduction of the Pacific Plate under the North American Plate and forms part of the larger Aleutian Arc, which includes more than 60 volcanoes on the Aleutian Islands and the Aleutian Range on the Alaska mainland. Previous to its recent period of activity, Bogoslof had last erupted in 1992, and its above-water surface area was a mere 0.11 square miles (0.29 square kilometers). As of March 11, the most recent data available, the area of the island had tripled to 0.38 square miles (0.98 square kilometers). The event on May 28 produced an ash cloud that reached 40,000 feet (12 km) in altitude, causing the Alaskan Volcano Observatory to issue a red alert for air travel in the area. Volcanic ash can cause major damage to aircraft engines, and the region is close to several major air routes between North America and Asia.

On May 28, 2017, at approximately 2:23 p.m. local time, NASA’s Terra satellite passed over Bogoslof, less than 10 minutes after the eruption began. MISR has nine cameras that view Earth at different angles. It takes slightly less than seven minutes for all nine cameras to view the same location on Earth. On the left, an animation made from the images from the nine MISR cameras, captured between 2:19 and 2:26 p.m., demonstrates how the angled views give a glimpse of the underside of the growing plume of volcanic ash, showing the eruption column widening into the cloud at the top.

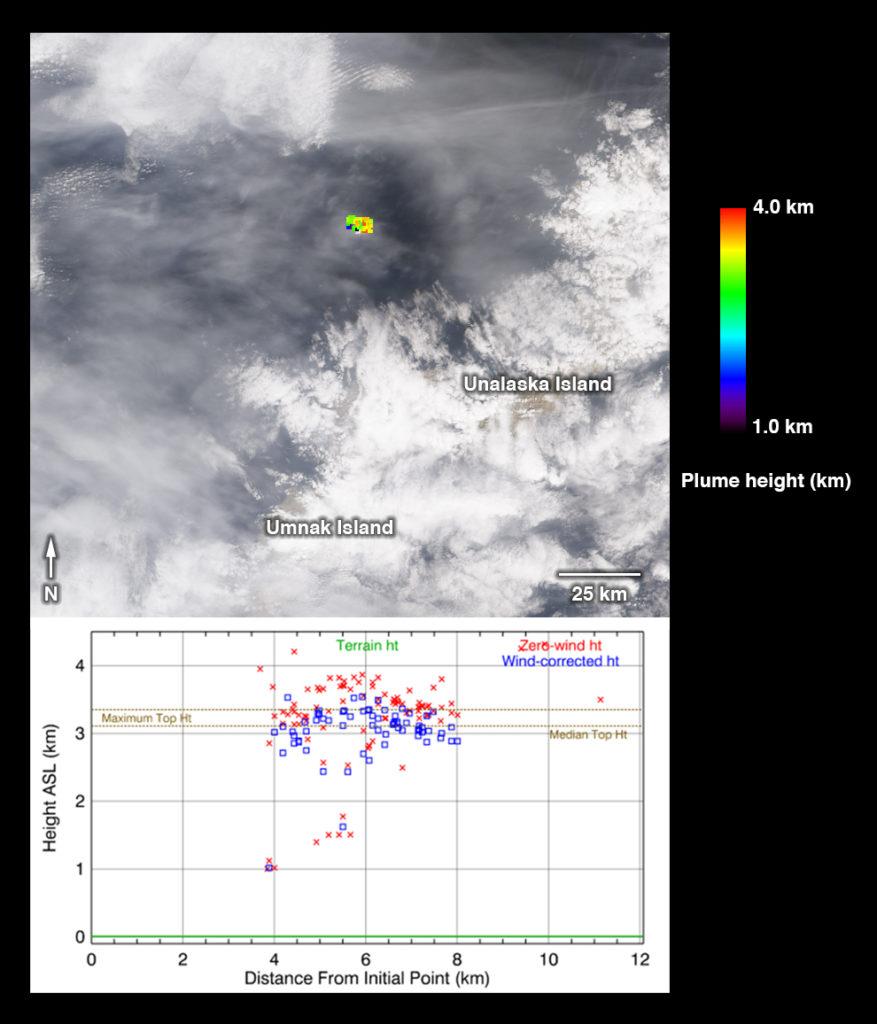
Data from MISR’s nine cameras can also be used to calculate the height of the plume, based on the apparent movement of the cloud from one camera to another. On the right, a map of plume height is plotted over the downward-looking image. The top of the cloud was approximately 10,000 feet (3 kilometers) high at this time. Below the image is a scatterplot of the heights, with blue points representing heights corrected by the northwesterly winds reported by the Alaskan Volcano Observatory during the eruption, and red points representing uncorrected heights. Lower points at either side of the plume represent retrievals of the eruption column.

These data were captured during Terra orbit 92786. The stereoscopic analysis was performed using the MISR INteractive eXplorer (MINX) software tool, which is publicly available through the Open Channel Foundation at https://www.openchannelsoftware.com/projects/MINX. Other MISR data are available through the NASA Langley Research Center; for more information, go to https://eosweb.larc.nasa.gov/project/misr/misr_table. MISR was built and is managed by NASA’s Jet Propulsion Laboratory in Pasadena, California, for NASA’s Science Mission Directorate in Washington, D.C. The Terra spacecraft is managed by NASA’s Goddard Space Flight Center in Greenbelt, Maryland. The MISR data were obtained from the NASA Langley Research Center Atmospheric Science Data Center in Hampton, Virginia. JPL is a division of the California Institute of Technology in Pasadena.

Credit: NASA/GSFC/LaRC/JPL-Caltech, MISR Team, article by Abbey Nasten

caspiansea_amo_2016158

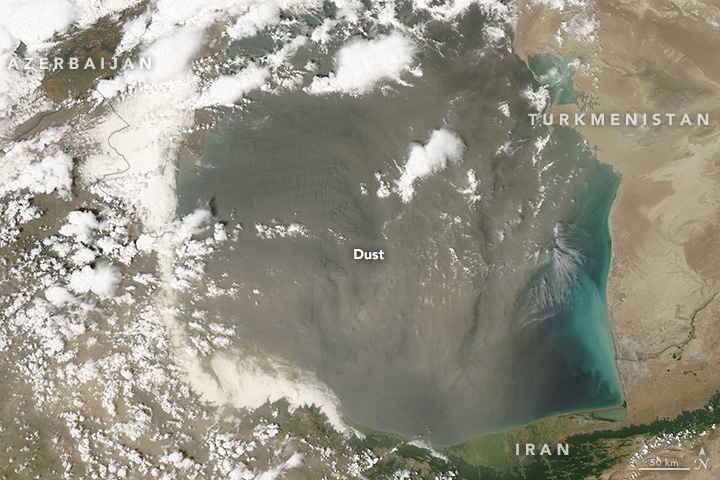
Does Dust Affect Water Levels of the Caspian Sea

June 10, 2016

Dust storms over the Caspian Sea lead to increased evaporation and a drop in lake level according to new research using observations of dust collected by instruments on several satellites including the Moderate Imaging Spectroradiometer (MODIS ) and the Multi-angle Imaging Spectroradiometer (MISR) on Terra.


ruapehu_ast_2016111

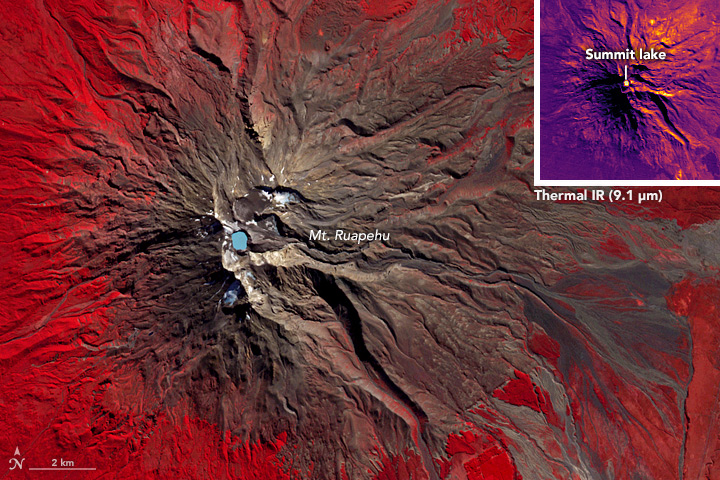
A Satellite Eye on Mount Ruapehu

June 5, 2010

Mount Ruapehu is one of New Zealand’s most active volcanoes and most visited, dotted with skiers and snowboarders along its slopes.  When it erupts lahars, flows of volcanic debris and sediment, can have devastating impacts, prompting geologists to regularly monitor the volcano, using the Advanced Spaceborne Thermal Emission and Reflection Radiometer on NASA’s Terra satellite.


McMurray 720_MODIS_06052016

fort_mcmurray_NRT+AOD_col_d[7]
NASA  Images from NASA Worldview (above) and created with data from MOPITT and MODIS (below) provided by the MOPITT Science Team. Caption by Sara Martinez-Alonso with Tassia Owen.

May 24, 2016
The Fort McMurray wildfire in Alberta, Canada not only had devastating impacts on its community, but the effect on air quality was also far reaching. Along with drifting smoke, wildfires cause increases in atmospheric carbon monoxide levels.

These maps were produced using data acquired by MOPITT and MODIS, two of the instruments on board NASA’s Terra satellite. These maps document the extent and composition of the Fort McMurray fire plume on May 6th and 7th.

MOPITT measures tropospheric carbon monoxide (CO). CO is mostly produced by incomplete fuel combustion, biomass burning, and oxidation of methane and other hydrocarbons. Shown here are MOPITT retrievals of CO total column generated in near real-time for use in the ECMWF MACC-III global data assimilation and forecasting system.

MODIS analyzes, among others, atmospheric aerosols, one of the greatest sources of uncertainty in climate modeling. The MODIS map shown here depicts aerosol optical depth (AOD), a measure of the extinction of solar light by atmospheric particles.

The similarity in the features shown in the two maps is quite obvious. The plume originates near Fort McMurray (shown with an asterisk) and extends mostly southeast for more than 1000 miles (1600 km), crossing state and country boundaries.