Tag: Atmosphere

Atmosphere News and Events

McMurray 720_MODIS_06052016

fort_mcmurray_NRT+AOD_col_d[7]
NASA  Images from NASA Worldview (above) and created with data from MOPITT and MODIS (below) provided by the MOPITT Science Team. Caption by Sara Martinez-Alonso with Tassia Owen.

May 24, 2016
The Fort McMurray wildfire in Alberta, Canada not only had devastating impacts on its community, but the effect on air quality was also far reaching. Along with drifting smoke, wildfires cause increases in atmospheric carbon monoxide levels.

These maps were produced using data acquired by MOPITT and MODIS, two of the instruments on board NASA’s Terra satellite. These maps document the extent and composition of the Fort McMurray fire plume on May 6th and 7th.

MOPITT measures tropospheric carbon monoxide (CO). CO is mostly produced by incomplete fuel combustion, biomass burning, and oxidation of methane and other hydrocarbons. Shown here are MOPITT retrievals of CO total column generated in near real-time for use in the ECMWF MACC-III global data assimilation and forecasting system.

MODIS analyzes, among others, atmospheric aerosols, one of the greatest sources of uncertainty in climate modeling. The MODIS map shown here depicts aerosol optical depth (AOD), a measure of the extinction of solar light by atmospheric particles.

The similarity in the features shown in the two maps is quite obvious. The plume originates near Fort McMurray (shown with an asterisk) and extends mostly southeast for more than 1000 miles (1600 km), crossing state and country boundaries.

February 19, 2016
Ash Plume and Sea Ice Near Zhupanovsky – Since October, 2015 Zhupanovsky volcano in far eastern Russia has periodically been spewing ash into the atmosphere.  This MODIS image from February 13, 2016 shows an ash plume from Zhupanovsky volcano, which resulted in a code-red for air travel in the region.

Sea surface temperatures indicated that the warm "blob" has dissipated. NASA Earth Observatory image by Jesse Allen, using microwave and infrared multi-sensor SST data from Remote Sensing Systems.

February 12, 2016
The Demise of the Warm Blob – Ocean surface temperatures, showed a warm “blob” off the northern United State’s coast. This cell of warm ocean water in the Pacific Ocean no longer is present, having lasted from the winter of 2013 through December of 2015.

February 17, 2016
Waves Above and Below the Water – The Moderate Imaging Spectroradiometer on NASA’s Terra satellite acquired an image of wave patterns in the sky and in the water off the coast of Western Australia.

MODIS image of cloud streets over the Great Lakes.

February 11, 2016
Cloud Streets Over the Great Lakes – MODIS captured this image of cloud streets crossing the Great Lakes.

February 10, 2016
Snow in the Central U.S. – Snow from a blizzard blanketed parts of the Midwest. This image from Terra’s Moderate Imaging Spectroradiometer (MODIS) captured the snow that remained after the clouds cleared over Nebraska.

February 6, 2016
Open- and Closed-Celled Clouds over the Pacific – Terra’s Moderate Imaging Spectroradiometer (MODIS) captured in one image examples of two different types of convective clouds, open-celled and closed-celled.

February 5, 2016
Mount Erebus, Antarctica – Mount Erebus in Antarctica, thought to be the most southern volcano is still active. The Advanced Spaceborne Thermal Emissions and Reflection Radiometer (ASTER) on NASA’s Terra satellite captured images in visible and infrared, showing not just the volcano, but also the lava lake in its interior.

safricandvipa_tmo_201512

February 3, 2016
Drought in Southern Africa – Normalized Difference Vegetation Index (NDVI) data from Terra’s Moderate Imaging Spectroradiometer (MODIS) sensor are being used to track drought conditions in southern Africa, analyzing the effects of the current strong El Niño on vegetation.

Terra images were featured on NASA’s Earth Observatory this December.

Icebergs Make Waves off South Georgia Island – Features Moderate Imaging Spectroradiometer (MODIS) images showing icebergs floating offshore of South Georgia Island, more than 1,600 kilometers (1,000 miles) east-northeast of South America’s southern tip. The icebergs make waves in the atmosphere.


indonesia_mop_201509Fires Put a Carbon Monoxide Cloud over Indonesia – Measurements of Pollution in the Troposphere (MOPITT) is used to monitor carbon monoxide from fires in Indonesia.


britishcolumbia_tmo_2015333_falsecolorShades of White – MODIS images enable distinction between fog and snow from space


urals_ast_2011194The Ural Mountains – The Advanced Spaceborne Thermal Emission and Reflection Radiometer (ASTER) captured images of the Ural Mountains.


ugab_ast_2000350Letter Y: Ugab River, Namibia
The Ugab River looks like a “Y” in the Earth Observatories feature, Reading the ABCs from Space. ASTER on NASA’s Terra satellite captured this false-colored image of the Ugab River running through what appears to be a field of yardangs in northern Namibia.


northpacific_tmo_2009063Letter N for the New Year
Shiptracks in the atmosphere are visible in this image from NASA’s Terra satellite’s Moderate Imaging Spectroradiometer (MODIS) as part of the new feature, Reading the ABCs from Space from NASA’s Earth Observatory. N is for New Year was the final Image of the Day for 2015.

The American Geophysical Union recently concluded its Fall meeting in San Fransisco, California from December 14 – 18, 2015.  As part of the meeting contributions to science were featured on NASA.gov.  Data from Terra’s instruments played important roles in collecting data to further research in each of these featured areas.  Read the full features from NASA.gov available at the links below.

El Niño

NASA: Observing the 2015 El Niño – The strongest El Niño since 1997 – 1998 is being monitored for the first time by a host of satellites, including Terra. This video (above) features global data sets from Terra’s instruments and their contribution to El Niño research.

How NASA Sees El Niño Effects From Space – The Moderate Imaging Spectroradiometer (MODIS) contributes to data collection on fires and hurricane monitoring

NASA Examines Global Impact of the 2015 El Niño – El Niño research pulls from data from Terra’s 16 years of data collection, monitoring Earth’s systems from Space

Warming Lakes
Study Shows Climate Change Rapidly Warming World’s Lakes – The Advanced Spaceborne Thermal Emission and Reflection Radiometer (ASTER) contributed to this study.

Earthquakes
Studies of Recent and Ancient Nepal Quakes Yield Surprises – The Advanced Spaceborne Thermal Emission and Reflection Radiometer (ASTER) contributed to this study.

Portrait of Lin Chambers on blue background

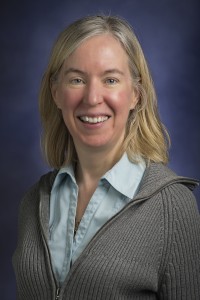
Lin Hartung Chambers, a climate scientist and educator at NASA Langley Research Center in Hampton, Virginia, named a fellow of the American Association for the Advancement of Science. Credits: NASA Langley Research Center

Written by Chris Rink
NASA Langley Research Center, Hampton, VA

A climate scientist and educator at NASA’s Langley Research Center in Hampton, Virginia, has been named a fellow of the American Association for the Advancement of Science (AAAS), the world’s largest general scientific society.

The lead for education and communication at NASA Langley’s Science Directorate, Lin Hartung Chambers was among 347 members who were selected for their efforts to advance science or its applications in a scientifically or socially distinguished way.

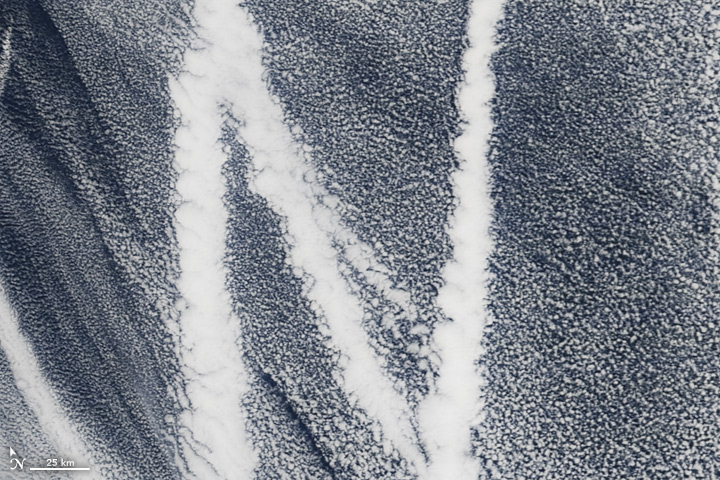
As principal investigator for the MY NASA DATA project, Chambers makes NASA’s large collection of scientific data about the Earth more accessible to a wide audience, including both K-12 teachers and students, and the Citizen Science community. She is also the director of the Students’ Cloud Observations On-Line (S’COOL) Project, a program she created to use K-12 student data for validation of NASA’s Clouds and the Earth’s Radiant Energy System (CERES) satellite instrument cloud measurement products. Chambers was also a project scientist for the NASA Global Climate Change Education project working with a multi-agency community of climate change education funders and awardees.

The AAAS recognized Chambers for “For distinguished contributions to science education, particularly the coordination of students’ contributions to satellite data validation and improving the synergy of climate change education efforts.”

“It is a great honor to have my work recognized by my peers through AAAS,” Chambers said. “After nearly 19 years we continue to have enthusiastic participation from students ground-truthing satellite data, and we continue to evolve our activities to make their participation as rewarding as possible.”

Founded in 1848, AAAS is the publisher of the journal Science and includes 254 affiliated societies and academies of science serving 10 million people. The non-profit AAAS is open to all and fulfills its mission to “advance science and serve society” through initiatives in science policy, international programs, science education and more. The tradition of AAAS fellows began in 1874; members are considered for the rank of fellow if they are nominated and approved by their peers.

Chambers and the other new fellows will be presented with an official certificate and a gold and blue rosette pin representing science and engineering on Saturday, Feb. 13, from 8 a.m. to 10 a.m. at the AAAS Fellows Forum during the 2016 AAAS Annual Meeting in Washington, D.C. Chambers has a doctorate in aerospace engineering from North Carolina State University and received bachelor’s and master’s degrees in aeronautical engineering from Rensselaer Polytechnic Institute in Troy, New York. She has authored or co-authored more than 40 journal papers on science, engineering, and education and public outreach.

For more information about AAAS, visit:

www.aaas.org

For more information about NASA Langley, go to:

www.nasa.gov/langley
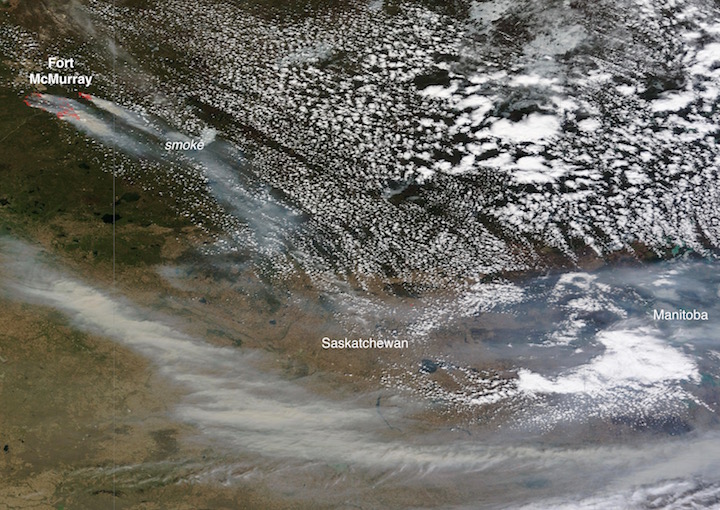