![fort_mcmurray_NRT+AOD_col_d[7]](https://terra.nasa.gov/wp-content/uploads/2016/06/fort_mcmurray_NRTAOD_col_d7.jpeg)
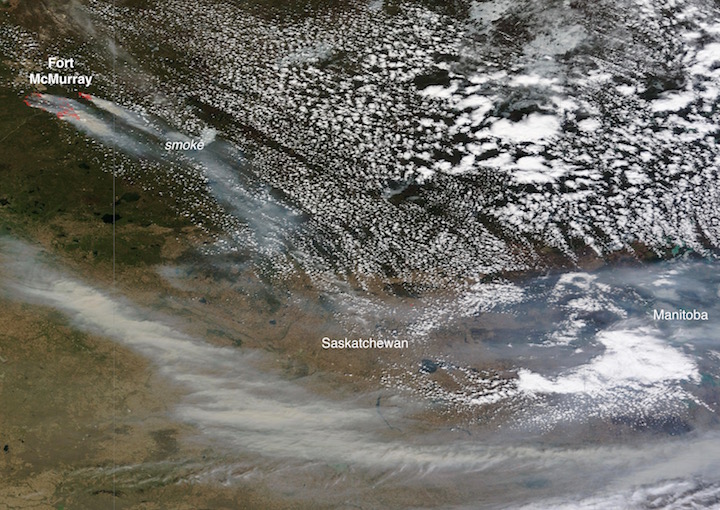
NASA Images from NASA Worldview (above) and created with data from MOPITT and MODIS (below) provided by the MOPITT Science Team. Caption by Sara Martinez-Alonso with Tassia Owen.
May 24, 2016
The Fort McMurray wildfire in Alberta, Canada not only had devastating impacts on its community, but the effect on air quality was also far reaching. Along with drifting smoke, wildfires cause increases in atmospheric carbon monoxide levels.
These maps were produced using data acquired by MOPITT and MODIS, two of the instruments on board NASA’s Terra satellite. These maps document the extent and composition of the Fort McMurray fire plume on May 6th and 7th.
MOPITT measures tropospheric carbon monoxide (CO). CO is mostly produced by incomplete fuel combustion, biomass burning, and oxidation of methane and other hydrocarbons. Shown here are MOPITT retrievals of CO total column generated in near real-time for use in the ECMWF MACC-III global data assimilation and forecasting system.
MODIS analyzes, among others, atmospheric aerosols, one of the greatest sources of uncertainty in climate modeling. The MODIS map shown here depicts aerosol optical depth (AOD), a measure of the extinction of solar light by atmospheric particles.
The similarity in the features shown in the two maps is quite obvious. The plume originates near Fort McMurray (shown with an asterisk) and extends mostly southeast for more than 1000 miles (1600 km), crossing state and country boundaries.


