Month: August 2020

Aug. 25, 2020 – NASA’s Terra Satellite Catches the Demise of Post-Tropical Cyclone Marco

By Rob Gutro
NASA’s Goddard Space Flight Center

Originally posted on https://blogs.nasa.gov/hurricanes/tag/td14-2020/

NASA’s Terra satellite passed over the Gulf of Mexico early on Aug. 25 and found a very small area of convection from post-tropical cyclone Marco, northeast of its center. All watches and warnings have been dropped as the storm continues to weaken toward dissipation.

Terra image of Marco
On Aug. 25 at 12:30 a.m. EDT (0430 UTC), the MODIS instrument that flies aboard NASA’s Terra satellite gathered infrared data on post-tropical cyclone Marco that showed a small area of storms where cloud top temperatures were as cold as minus 50 degrees Fahrenheit (minus 45.5 Celsius). Credit: NASA/NRL

Visible imagery and surface observations indicated that Marco made landfall around 7 p.m. EDT on Aug. 24 near the mouth of the Mississippi River. The center continued to move west and moved offshore and south of Louisiana by Aug. 25.

NASA’s Terra Satellite Reveals Effects of Wind Shear 

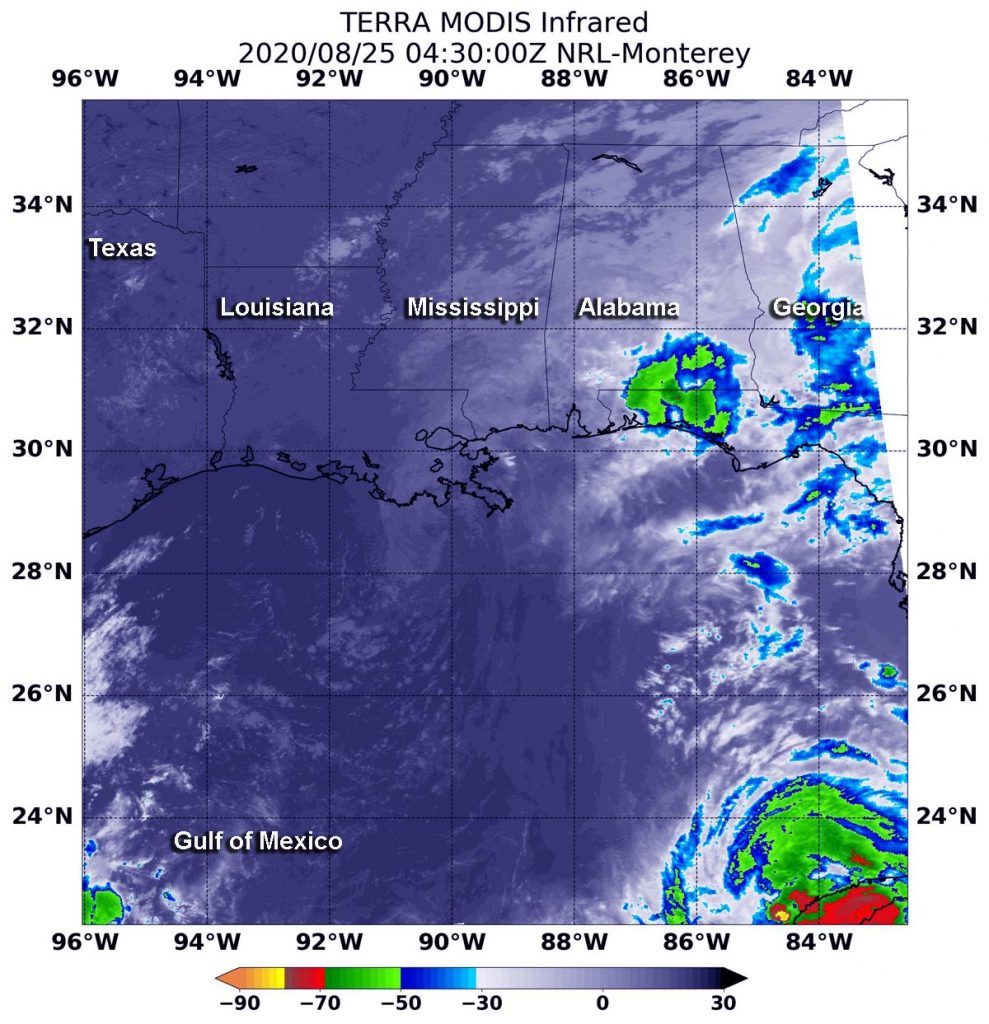
NASA’s Terra satellite uses infrared light to analyze the strength of storms by providing temperature information about the system’s clouds. The strongest thunderstorms that reach high into the atmosphere have the coldest cloud top temperatures.

On Aug. 25 at 12:30 a.m. EDT (0430 UTC), the Moderate Resolution Imaging Spectroradiometer or MODIS instrument that flies aboard NASA’s Terra satellite observed Marco in infrared light and found a small area of storms where cloud top temperatures as cold as minus 50 degrees Fahrenheit (minus 45.5 Celsius) over the western Florida Panhandle and coastal Alabama. Those storms were being pushed northeast of Marco’s center from southwesterly wind shear. Satellite imagery also shows the low-level circulation center was a swirl of clouds south of Louisiana, over the Gulf of Mexico.

In the Aug. 25, Marco discussion at 5 a.m. EDT, NHC Senior Hurricane Specialist Stacy Stewart noted, “Marco has been devoid of any significant convection for at least 12 hours.  [NOAA’s Advanced Scatterometer] ASCAT scatterometer surface wind data around 0239Z (10:39 p.m. EDT on Aug. 24) suggested that Marco might have degenerated in a north-to-south elongated trough (elongated area of low pressure). Based on this information, Marco has been downgraded to post-tropical remnant low [pressure area].”

About Wind Shear  

The shape of a tropical cyclone provides forecasters with an idea of its organization and strength. When outside winds batter a storm, it can change the storm’s shape and push much of the associated clouds and rain to one side of it. That is what wind shear does.

In general, wind shear is a measure of how the speed and direction of winds change with altitude. Tropical cyclones are like rotating cylinders of winds. Each level needs to be stacked on top each other vertically in order for the storm to maintain strength or intensify. Wind shear occurs when winds at different levels of the atmosphere push against the rotating cylinder of winds, weakening the rotation by pushing it apart at different levels.

Marco’s Final Status

At 5 a.m. EDT (0900 UTC) on Aug. 25, NOAA’s National Hurricane Center (NHC) reported the center of Post-Tropical Cyclone Marco was located near latitude 28.8 degrees north and longitude 91.2 degrees west. That is about 60 miles (100 km) south of Morgan City, La. and 110 miles (175 km) south-southeast of Lafayette, La. The post-tropical cyclone was moving toward the west near 10 mph (17 kph), and this general motion is expected to continue for the next day or so. Maximum sustained winds were near 30 mph (45 kph) with higher gusts. The estimated minimum central pressure was 1008.

Marco Nears its End

Brisk southwesterly vertical wind shear of 30 knots is forecast to increase to near 35 knots in 24 hours, which should prevent the redevelopment of deep convection near the center. On the forecast track, Marco should continue moving westward just offshore the coast of Louisiana until the system dissipates.

NASA Researches Tropical Cyclones

Hurricanes/tropical cyclones are the most powerful weather events on Earth. NASA’s expertise in space and scientific exploration contributes to essential services provided to the American people by other federal agencies, such as hurricane weather forecasting.

For more than five decades, NASA has used the vantage point of space to understand and explore our home planet, improve lives and safeguard our future. NASA brings together technology, science, and unique global Earth observations to provide societal benefits and strengthen our nation. Advancing knowledge of our home planet contributes directly to America’s leadership in space and scientific exploration.

For updated forecasts. visit: www.nhc.noaa.gov

July 14, 2020 ASTER image of the St. Patrick Bay Icecaps, Hazen Plateau, Ellesmere Island, Canada, shows that the icecaps have disappeared. Mapping of the icecaps’ extent using aerial photos, GPS, and ASTER images, from 1959 to present, documents their shrinking and eventual vanishing.

Scientists have been researching how Arctic glaciers responded to global warming as a result of significant temperature increases at the northern polar region?

A July 14, 2020 ASTER image of the St. Patrick Bay Icecaps, Hazen Plateau, Ellesmere Island, Canada, shows that the icecaps have disappeared. Mapping of the icecaps’ extent using aerial photos, GPS, and ASTER images, from 1959 to present, documents their shrinking and eventual vanishing.

Dr. Mark Sezerre (Director of NSIDC), said: “We’ve long known that as climate change takes hold, the effects would be especially pronounced in the Arctic. They’re the victims of human-caused warming that has occurred three times more rapidly in the Arctic than anywhere else.” Satellite data provide the most important method to monitor cryosphere changes on the Earth.

News agency stories that featured this ASTER story:

-discovermagazine.com/environment/going-going-gone-two-arctic-ice-caps-have-disappeared

-cbsnews.com/news/ice-caps-formed-during-little-ice-age-roughly-5000-years-ago-completely-disappear-from-canada/

-sciencealert.com/a-grim-2017-prediction-about-the-canadian-ice-caps-has-come-true

-whowhatwhy.org/2020/08/04/this-tool-could-protect-your-photos-from-facial-recognition/

-wildhunt.org/2020/08/pagan-community-news-new-witchual-workout-from-zakroff-adocentyn-research-library-announces-new-website-melted-canadian-ice-caps-and-more.html

-livescience.com/canadian-ice-caps-melted.html

-phys.org/news/2020-07-canadian-ice-caps-scientific.html

CERES Fall 2020 Science Team Meeting will take place
September 15-18, 2020. For more information visit https://ceres.larc.nasa.gov/ceres-science-team-meetings/.

Copious clouds of smoke spill off the California coast and travel almost 600 miles in NASA’s Terra satellite image from Aug. 19, 2020.  In the year 2020, California has already seen 5,762 incidents affecting 204,481 acres (319 sq. miles). That is more than quadruple the number of acres burned in 2019 per CAL Fire. More than 22,000 residents have now been asked to evacuate ahead of the spreading fires near San Mateo and Santa Cruz.  Near Vacaville, 10,000 residents have been asked to evacuate. Fifty structures have been destroyed and 50 more are in danger just in that area. So many fires have started around Sonoma, Lake, Napa and Solano counties that they have been dubbed the LNU Lightning Complex because they all began from lightning strikes from summer storms. California continues to experience a sweltering late summer heat wave that has broken several record highs in recent days. The hot, dry conditions are expected to continue at least into the weekend providing perfect conditions for more wildfire outbreaks. California Gov. Gavin Newsom has declared a state of emergency due to the fires on Tuesday. 

NASA’s Earth Observing System Data and Information System (EOSDIS) Worldview application provides the capability to interactively browse over 700 global, full-resolution satellite imagery layers and then download the underlying data. Many of the available imagery layers are updated within three hours of observation, essentially showing the entire Earth as it looks “right now.” Actively burning fires, detected by thermal bands, are shown as red points. Image Courtesy: NASA Worldview, Earth Observing System Data and Information System (EOSDIS).

Caption: Lynn Jenner with information from CAL Fire.

Last Updated: Aug. 19, 2020

Editor: Lynn Jenner

Originally posted on nasa.gov.

Story picked up on other news sources:

https://www.noozhawk.com/article/satellite_launched_from_vandenberg_afb_captures_long_path_of_smoke_wildfire

https://www.space.com/california-wildfires-satellite-photos-august-2020.html

https://www.lakeconews.com/index.php/news/66419-nasa-s-terra-images-the-1-200-plus-mile-trail-of-smoke-from-california-fires

https://scitechdaily.com/nasas-terra-satellite-captures-the-scene-of-intense-wildfires-in-california/

-Kurt Thome, Terra Project Scientist

On February 27, 2020, the Terra flight operations team conducted Terra’s last inclination adjust maneuver.   The inclination adjust maneuver is one of three basic maneuvers requiring fuel that the Terra Flight Operations Team uses to maintain Terra’s orbit and the safety of the platform.  Inclination adjust maneuvers are used to control the platform’s mean local time (MLT) of its equator crossing.  The other two are drag makeup maneuvers (DMUs) to control the orbital altitude (apogee and perigee) and risk mitigation maneuvers (RMM), or debris avoidance maneuver (DAMs), that are used to protect the platform from collisions with known on-orbit debris or other spacecraft.

The importance of orbit maintenance is that changes in orbit can affect the quality of data from a sensor.  Earlier crossing times for a morning platform like Terra mean lower solar elevations (leading to more prevalent shadows), decreased cloud probabilities, lower surface temperatures, and lower reflected energy (leading to lower signals).  A decrease in orbit altitude alters the spatial coverage of the sensor including possible gaps in spatial sampling, decreased spatial coverage, but better spatial resolution. 

The flight operations team works to maintain both crossing time and platform altitude to provide the highest quality data.  The trade is that fuel is often a life-limiting factor for long-life platforms.  The amount of maneuvering fuel is a trade between platform weight at launch, expected platform life, and safe disposal of the platform at end of life. Fuel use is dominated by inclination maneuvers since they require significantly more fuel than drag makeup maneuvers.

Fortunately, Terra benefited from a near perfect launch and accurate orbit insertion by the launch vehicle leading to almost a full tank of fuel for maneuvering.  Inclination maneuvers have been done on average four times per year since launch to maintain Terra’s crossing time of 10:30 am (though it was 10:45 am for the first two years on orbit).  IAMs continued until the remaining fuel was just enough for a Constellation Exit and perigee-lowering burns.  The Constellation Exit lowers the platform’s orbit by 6 km to remove it from the 705-km orbit altitude of the Earth Sciences Constellation.  The perigee-lowering burns take place at the time of Terra’s passivation and all remaining fuel is used to lower Terra to begin its slow re-entry to an uncontrolled de-orbit.

After Terra’s IAM it began to drift to an earlier crossing time.  Drag makeup maneuvers are being continued to maintain Terra’s orbit altitude of 705 km.  Risk mitigation maneuvers will also continue to avoid orbital debris.  When Terra’s crossing time reaches a 10:15 AM MLT (currently predicted for October 2022), the flight operations team will have Terra exit the Earth Sciences Constellation and lower Terra to an altitude of 694 km by performing two retrograde maneuvers. Risk mitigation maneuvers continue, but no further drag make up maneuvers will take place and Terra will slowly decrease in altitude as well as continue drifting to an earlier MLT crossing.  It is predicted to reach a crossing time of 9:00 am in December 2025 at which point the perigee-lowering burns will take place to lower Terra by an additional 20 km.

Terra’s instruments will continue to be operational during this entire process.  The impacts of the changing crossing time are expected to be minimal and will impact the data from each of Terra’s five instruments in a slightly different fashion.  To learn more about the effects please visit the individual instrument websites. 

ASTER

CERES*

MISR

MODIS

MOPITT

*Information regarding impacts to instruments is still pending.

Key Dates of Drift

  • Exceed 10:30 MLT (+/- 1 min) – April 2021*
  • Exceed 10:15 MLT – September 2022*
  • Constellation Exit – September 2022*
  • Exceed 9:00 MLT– December 2025*

Passivation is expected to take place due to signal to noise limits from lower solar zenith angles, limited battery power from changing solar angle on the solar panels, or programmatic funding limits.

*Dates are subject to change.