Measurements of Pollution in the Troposphere (MOPITT) on NASA’s Terra Satellite collects data on atmospheric carbon monoxide (CO) levels in the atmosphere. Learn more about MOPITT’s newest science applications and contributions at the American Geophysical Union’s 2015 Fall Meeting.
On Tuesday, 15 December 2015 from 8:00 AM – 12:20 PM in Moscone South – Poster Hall.
“Separating Transported and Local Atmospheric Carbon Monoxide in Australasia with Satellite and Ground-based Remote Sensing,” by R. R. Buchholz, D. P. Edwards, M. N. Deeter, H. M. Worden, L. K. Emmons, N. B. Jones, C. Paton-Walsh, N. M. Deutscher, V. Velaszco, D. W. T. Griffith, J. Robinson and D. Smale
Abstract:
A range of measurement techniques are required to understand atmospheric composition. No single instrument can measure all you need to know about the atmosphere, due to differences in temporal and spatial scales. Satellites help interpret synoptic-scale contributions to composition, but provide little fine-scale information due to sparse measurement timing and spatial averaging. In contrast, ground-based solar-tracking FTIR instruments can capture fine-scale chemistry and dynamic influence, but being point measurements, have trouble identifying transported signals. Knowing the relative contribution of transported to local sources of atmospheric pollution is important for developing realistic air quality policies and providing accurate air quality forecasts.
In this study, we exploit the complementary limitations and sensitivities of two instruments to gain information about carbon monoxide (CO) sources at three stations in Australasia: Darwin and Wollongong in Australia and Lauder in New Zealand. Total column amounts of CO are compared between the satellite-borne Measurements of Pollution in the Troposphere (MOPITT) and ground-based solar FTIR instruments in the TCCON and NDACC networks. Several CO timeseries anomalies are highlighted as representative of pollution delivery pathways in relation to local, regional and long-distance contributions. Large-scale pollution events are captured by both instruments, but only the satellite instrument can provide regional and global context. MOPITT identifies long-range transport of pollution from biomass burning in South America and southern Africa, while the FTIR can additionally capture local urban and biomass burning influences. Unusually low CO, sourced from southern latitudes, is also measured by both instruments. Interannual variability is significantly different at each site and is diagnosed with chemical transport modeling (CAM-chem) to quantify the role of emissions versus meteorology.
On Wednesday, 16 December 2015 from 8:00 AM – 12:20 PM in Moscone South – Poster Hall.
“Carbon Monoxide Data Assimilation for Atmospheric Composition and Climate Science: Evaluating Performance with Current and Future Observations,” by Jérôme Barré, David Edwards, Helen Worden, Avelino Arellano, Benjamin Gaubert, Arlindo Da Silva, and Jeffrey Anderson
Abstract:
Current satellite observations of tropospheric composition made from low Earth orbit provide at best one or two measurements each day at any given location. Comparisons of Terra/MOPITT carbon monoxide (CO) and IASI/Metop CO observation assimilations will be presented. We use the DART Ensemble Adjustment Kalman Filter to assimilate observations in the CAM-Chem global chemistry-climate model. Data assimilation impacts due to both different instrument capabilities (i.e. vertical sensitivity and global coverage) will be discussed. Coverage is global but sparse, often with large uncertainties in individual measurements that limit examination of local and regional atmospheric composition over short time periods. This has hindered the operational uptake of these data for monitoring air quality and population exposure, and for initializing and evaluating chemical weather forecasts. By the end of the current decade there are planned geostationary Earth orbit (GEO) satellite missions for atmospheric composition over North America, East Asia and Europe with additional missions proposed. Together, these present the possibility of a constellation of geostationary platforms to achieve continuous time-resolved high-density observations of continental domains for mapping pollutant sources and variability on diurnal and local scales. We describe Observing System Simulation Experiments (OSSEs) to evaluate the contributions of these GEO missions to improve knowledge of near-surface air pollution due to intercontinental long-range transport and quantify chemical precursor emissions. Our approach uses an efficient computational method to sample a high-resolution global GEOS-5 chemistry Nature Run over each geographical region of the GEO constellation. The demonstration carbon monoxide (CO) observation simulator, which will be expanded to other chemical pollutants, currently produces multispectral retrievals (MOPITT-like) and captures realistic scene-dependent variation in measurement vertical sensitivity and cloud cover. The impact of observing over each region is evaluated independently. Winter and summer cases studies are investigated i.e. where emissions, cloud cover and CO lifetime significantly change.
On Tuesday, 15 December 2015 from 1:40 PM – 6:00 PM in Moscone South – Poster Hall.
“Limiting Factors for Satellite-Based Retrievals of Surface-Level Carbon Monoxide,” by Sara Martinez-Alonso, Merritt N Deeter, Helen Marie Worden, Jerome Barré, and The MOPITT Team
Abstract:
CO is mostly produced in the lower troposphere by incomplete combustion of biomass and fuels. CO oxidation consumes ~75% of the tropospheric OH, which then is not available to remove CH4 and other greenhouse gases. CO oxidation also leads to the production of tropospheric O3. These critical impacts of CO on air quality and climate require accurate determination of the abundance and evolution of CO near the surface.
Satellite retrievals would be well-suited to monitor surface CO globally. However, how do they compare to actual surface abundances? Some aspects to be considered include: the vertical sensitivity of retrievals (given by the averaging kernels), or how thick are the atmospheric layers that can be resolved; the vertical correlation length of CO with respect to the thickness of those layers; and the horizontal variability of CO with respect to the instrument’s footprint.
To investigate these questions we analyze MOPITT retrievals, DISCOVER-AQ and NOAA profiles, as well as WDCGG surface measurements. MOPITT, on board NASA’s Terra satellite, has been measuring tropospheric CO since 2000, providing the longest global CO record to date. Its unique multispectral CO product offers enhanced sensitivity to CO near the surface. Vertical profiles of the lower troposphere were acquired during the DISCOVER-AQ airborne campaigns over selected regions of the USA. NOAA’s airborne flask sampling program results in a multi-year, multi-seasonal record of vertical profiles from near the surface up to the mid troposphere, acquired over a number of stations, mostly in North America. Long-term, cross-calibrated surface CO data from ground stations worldwide are available through the WDCGG.
On Wednesday, 16 December 2015 from 8:00 AM – 12:20 PM in Moscone South – Poster Hall.
“Chemical Response of CESM/CAM-Chem to MOPITT CO Ensemble-based Chemical Data Assimilation,” by Benjamin Gaubert, Avelino F. Arellano, Jerome Barre, Helen M. Worden, Louisa K. Emmons, Simone Tilmes, Rebecca Buchholz, Christine Wiedinmyer, Francis Vitt, Jeffrey L. Anderson, Merritt N. Deeter, Jean-Francois Lamarque and David P. Edwards
Abstract:
Carbon Monoxide is a key component in tropospheric chemistry. It plays an important role by affecting the oxidative capacity through its reaction with OH and being a precursor of tropospheric ozone. One year of multispectral retrievals of CO partial columns obtained from the MOPITT instrument have been assimilated into the Community Atmosphere Model with Chemistry (CAM-Chem). The assimilation is carried out using an Ensemble Adjustment Kalman Filter algorithm within the Data Assimilation Research Testbed (DART) package. Two assimilation experiments have been performed: 1) assimilation of meteorological observations and 2) joint assimilation of meteorological observations and MOPITT CO. We first evaluate the assimilation performance by investigating skill scores and other statistics for the two experiments, and comparing to independent CO datasets such as surface (WDCGG), aircraft (MOZAIC-IAGOS), and FTS (NDACC). Our results clearly demonstrate an overall improvement for spatio-temporal magnitude and variability in representing CO abundance in CAM-Chem. We then investigate the response of CAM-Chem to changes in CO fields (via CO assimilation) focusing mainly on the oxidative capacity (i.e., OH distribution, methane lifetime) and CO chemical production and loss (i.e., regional to global budget). This is carried out by analyzing the mean 6-hourly forecast adjustments as reflected between the two experiments. We show that changes in CO directly impact OH abundance, with subsequent non-linear responses in CO chemical production (CO from methane and VOCs) and CO loss. This is clearly evident in NOx-limited regions (e.g., Southern Hemisphere, remote sites). Such analysis has direct implications on the consistencies in inverse modeling estimates of CO sources through improved representation of chemical response (including full chemistry) in atmospheric chemistry models and through multi-species constraints.
On Wednesday, 16 December 2015 from 11:35 AM – 11:50 AM in Moscone West – 3012
“Evaluation of Meteorology Data for MOPITT Operational Processing,” by Daniel Ziskin, Merritt Deeter, Helen Worden, Debbie Mao, and Vincil Dean
Abstract:
Measurements Of Pollution In The Troposphere[1] (MOPITT) is an instrument flying aboard NASA’s Terra satellite[2]. It measures CO using correlated spectroscopy[3]. As part of its processing it uses surface temperature, an atmospheric temperature profile and a water vapor profile from analysis. Since there are many analysis products on the market (e.g. GMAO, NCEP, ECMWF etc.) that meet MOPITT’s operational requirements, the question arises as to which product is most apt? There is a collection of “validation data” that MOPITT compares its CO retrievals against[4]. The validation dataset has been acquired by in situ air samples taken by aircraft at a series of altitudes. We can run our processing system in “validation mode” which processes the satellite data for only the days that validation data exists and for a spatial subset that corresponds to the region where the validation data has been collected. We will run the MOPITT retrievals in validation mode separately using each variety of analysis data. We will create a cost function that will provide a scalar estimate of the retrieved CO profile error relative to the validation dataset which is assumed to be “the truth”. The retrieval errors of each of the input datasets will be compared to each other to provide insight into the best choice for use in operational MOPITT processing.


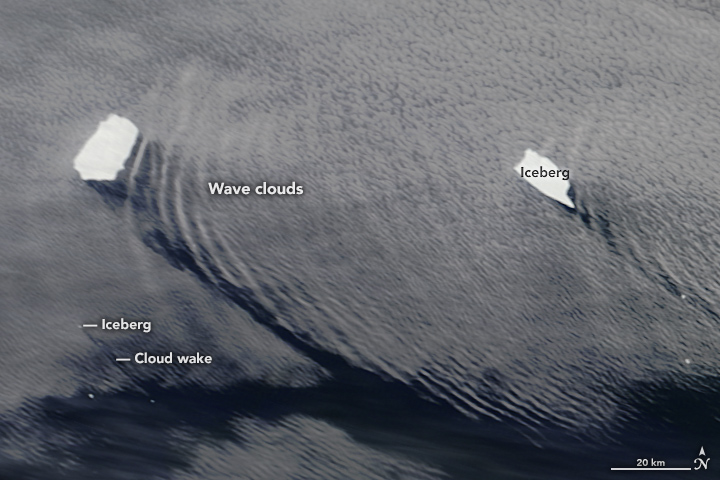 Icebergs Make Waves off South Georgia Island – Features Moderate Imaging Spectroradiometer (MODIS) images showing icebergs floating offshore of South Georgia Island, more than 1,600 kilometers (1,000 miles) east-northeast of South America’s southern tip. The icebergs make waves in the atmosphere.
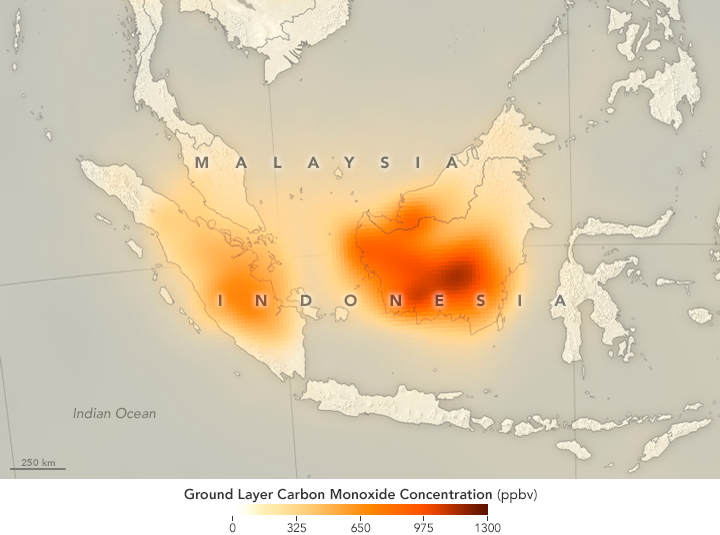 Fires Put a Carbon Monoxide Cloud over Indonesia – Measurements of Pollution in the Troposphere (MOPITT) is used to monitor carbon monoxide from fires in Indonesia.
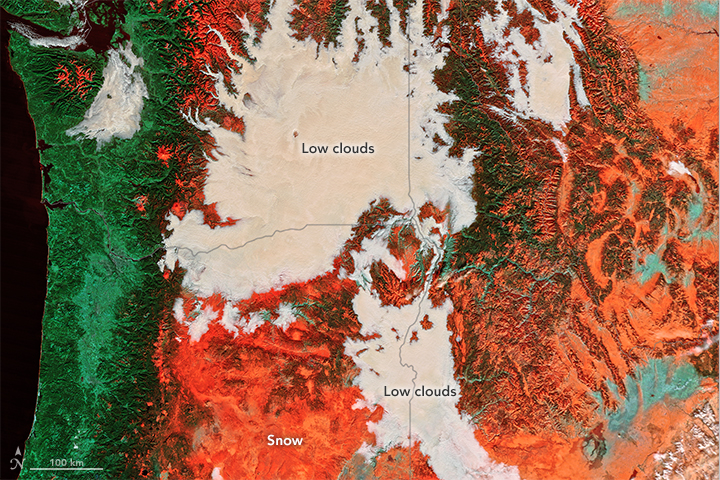 Shades of White – MODIS images enable distinction between fog and snow from space
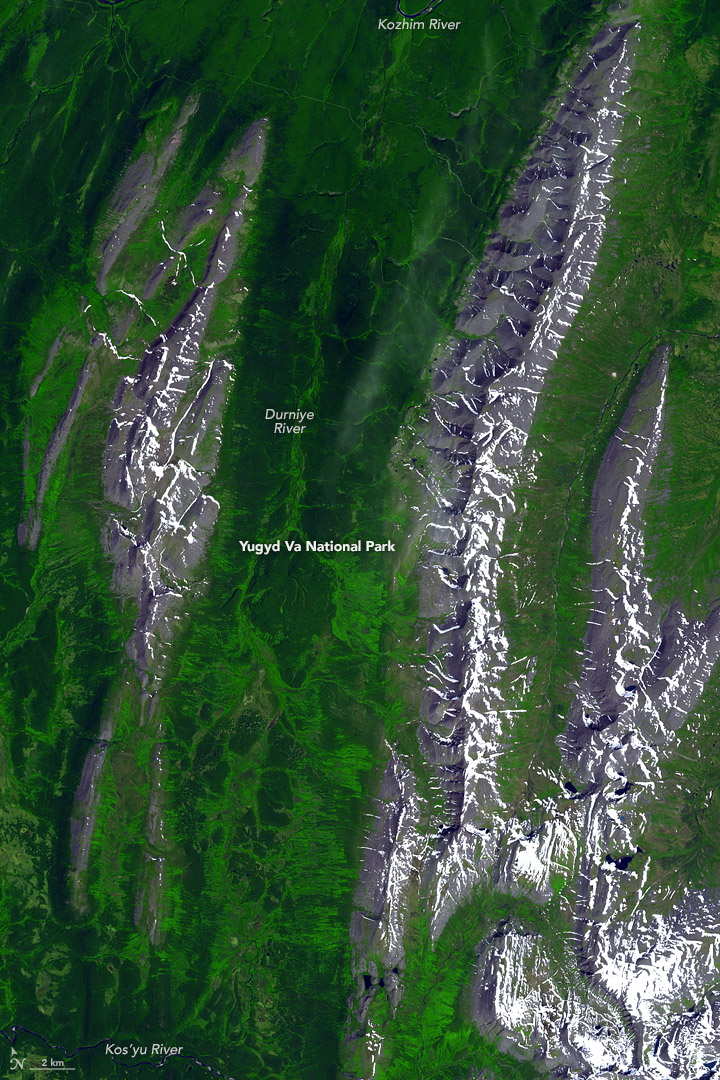 The Ural Mountains – The Advanced Spaceborne Thermal Emission and Reflection Radiometer (ASTER) captured images of the Ural Mountains.
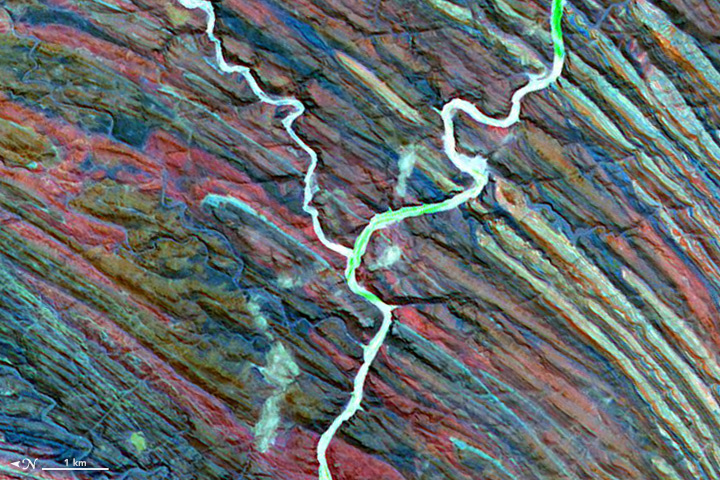 Letter Y: Ugab River, Namibia –
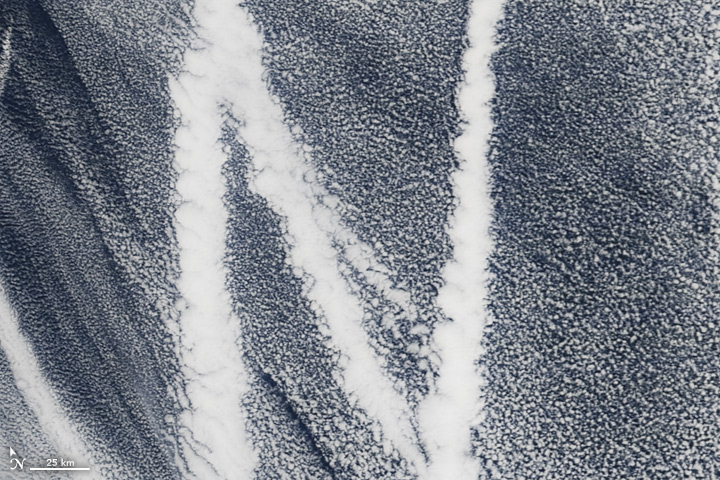 Letter N for the New Year –