A paper appearing recently in EOS shows
that Terra data is continually being used to test new modeling processes. In
this study, Terra cloud top height data was used as a tool to compare the
results of the superparamertization model to data from a day in April, 2012
over the Netherlands. The superparameterization model produced results that
more accurately depicted the cloud height data from Terra, than the standard
parameterized version of OpenIFS.
Terra is tracking fires in Indonesia. MODIS and VIIRS data have been used to count the number of blazes across the region, which is so far fewer than another recent fire year, 2015. However, some starts are burning in areas so thick with smoke that satellites can’t detect them or burning underground in Indonesia’s peat beds. Smoke, other aerosols, and emissions including carbon monoxide have been released into the air. Terra’s MISR, MODIS and MOPITT instruments track these airborne particles and chemicals, while new models are being tested.
With Amazon wildfires in the news, a study published in the journal of Ecohydrology uses ASTER data and data from the Large Scale Biosphere Atmosphere Experiment in Amazonia (LBA) to look at how changes to land cover in the Amazon affect the exchange of water and heat between the land surface and the atmosphere.
Gabriel Oliveira, Nathaniel A. Brunsell, Elisabete C. Moraes, Yosio E. Shimabukuro, Thiago V. Santos, Celso Randow, Renata G. Aguiar, Luiz E.O.C. Aragao. Effects of land‐cover changes on the partitioning of surface energy and water fluxes in Amazonia using high‐resolution satellite imagery. Ecohydrology, 2019; DOI: 10.1002/eco.2126
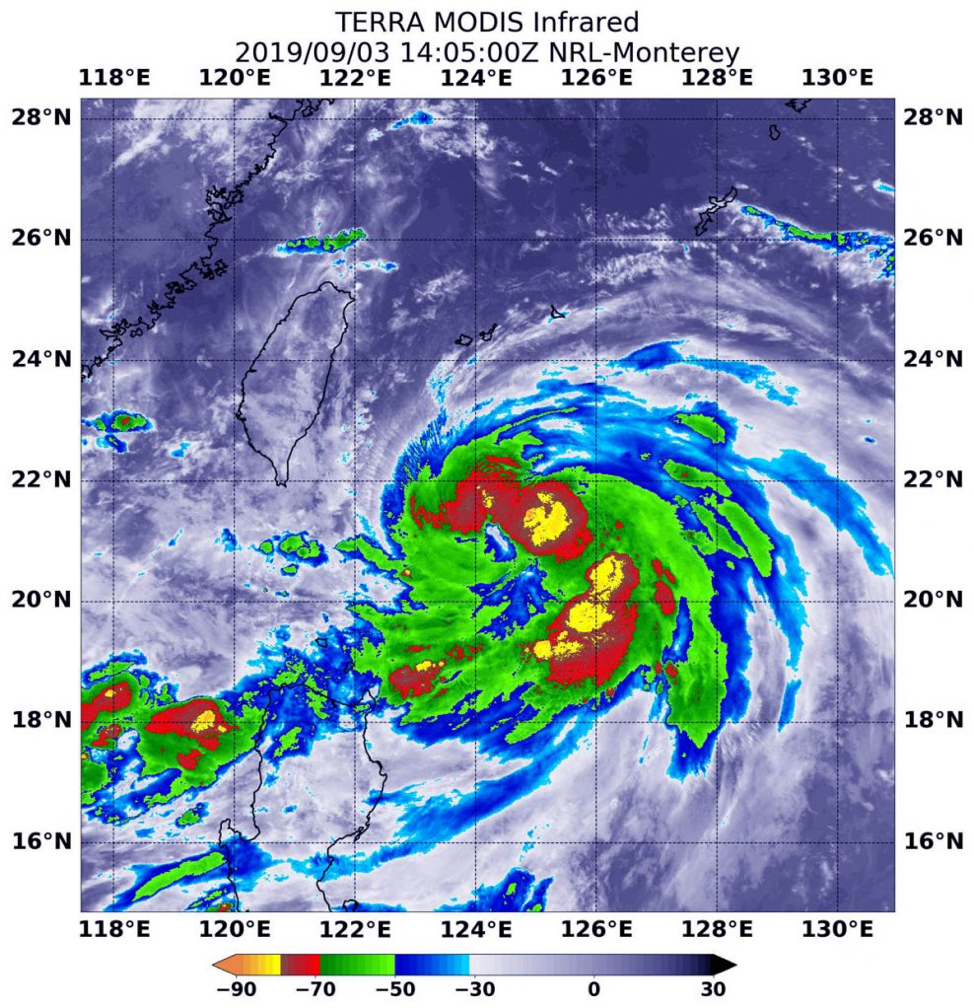
Sep. 03, 2019 – NASA Infrared Eye Analyzes Typhoon Lingling
The storm that became
Typhoon Lingling strengthened very quickly in the Northwestern Pacific Ocean
and infrared imagery from NASA revealed the powerful thunderstorms fueling that
intensification.
On
Sept. 3 at 12:05 p.m. EDT (1405 UTC) the MODIS instrument that flies aboard
NASA’s Terra satellite showed areas northeast and southeast of Typhoon
Lingling’s center where cloud top temperatures were as cold as minus 80 degrees
Fahrenheit (minus 62.2 Celsius). Credit: NASA/NRL
Lingling formed on Sept.
2 as Tropical Depression 15W and strengthened quickly into a tropical storm and
then a typhoon. Although Lingling is to the northeast of Luzon, northern
Philippines, there are still some warning signals in effect on Sept. 3.
Tropical cyclone wind signal #1 is in effect over the Luzon province of
Batanes.
On Sept. 3 at 12:05 p.m.
EDT (1405 UTC), the Moderate Imaging Spectroradiometer or MODIS instrument that
flies aboard NASA’s Terra satellite used infrared light to analyze the strength
of storms within the typhoon. NASA researches these storms to determine how
they rapidly intensify, develop and behave.
Tropical cyclones are
made of up hundreds of thunderstorms, and infrared data can show where the
strongest storms are located. They can do that because infrared data provides
temperature information, and the strongest thunderstorms that reach highest
into the atmosphere have the coldest cloud top temperatures.
MODIS found those
strongest storms were northeast and southeast of the center of circulation
where cloud top temperatures were as cold as minus 80 degrees Fahrenheit (minus
62.2 Celsius). NASA research has found that cloud top temperatures that cold
indicate strong storms with the potential to generate heavy rainfall.
At 11 a.m. EDT (1500
UTC), the Joint Typhoon Warning Center or JTWC said that Typhoon Lingling,
known locally in the Philippines as Liwayway was located near 21.4 degrees
north latitude and 124.2 degrees east longitude. That is 364 nautical miles
southwest of Kadena Air Base, Okinawa, Japan. Lingling was moving to the north
and had maximum sustained winds near 65 knots (75 mph/120.3 kph).
JTWC forecasters said
that Lingling is moving north and is expected to intensify to 100 knots (115
mph/185 kph) upon passing east of Taiwan. The system will then weaken on
approach to the Korean peninsula, but still be at typhoon strength.