Image from TERRA
Tue, 20 Sep 2022 10:30 EDT

Water departments in the West are using maps and models originally created by a NASA team to help track water.

Image from TERRA
Thu, 15 Sep 2022 10:00 EDT

NASA and Google broadened an existing partnership to help local governments improve their monitoring and prediction of air quality for better decision making.

Image from TERRA
Mon, 11 Jul 2022 09:30 EDT

Ozone pollution assessments made for the Great Lakes region now include NASA satellite and other near-real time Earth observations.

Tag: Earth’s Surface and Interior

Earth’s Surface and Interior

It’s been a busy summer for the MODIS instrument! Here are a few highlights you may have missed:

‣ On July 1st, our long-serving MODIS instrument lead, Dr. Michael King, officially retired. While we’re sad to see him go and wish him the best in his new adventures, we’re excited to introduce our new MODIS lead, Dr. Miguel Roman! Look for his updated bio on the Terra website soon.

‣ The NASA Land and Atmosphere data teams held meetings in May and June (you can find presentation materials and more info with this link to the MODIS newsfeed). 

‣ A brand new reprocessed MODIS cloud properties dataset that combines both Terra and Aqua data is now available for download and use. Find out more information in this informative post from the LAADS DAAC

‣ Check out these two recent research features on the Natural Capital Project (links here and here), a collaboration among scientists, farmers, and the luxury clothing industry. Terra MODIS vegetation index data products are being used as part of this effort to model future goat-grazing land use in order to benefit both farmers and the environment. Frequent sampling and wide area coverage of MODIS normalized difference vegetation index (NDVI) dataset were leveraged and used as input for climate models, resulting in more sustainable land-use practices.


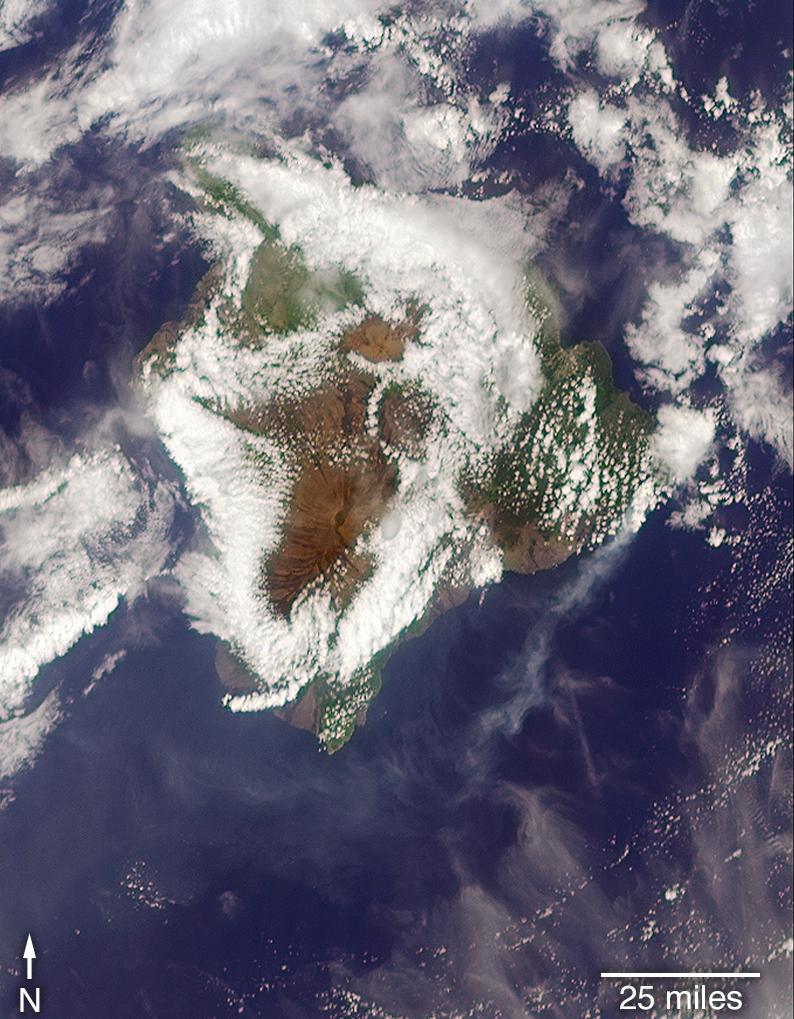
On May 6, 2018 as Kilauea continued to erupt, MISR passed overhead at approximately 11 a.m. local time, capturing this view of the island. While much of the island is covered by clouds, the eruption plume is visible streaming southwest over the ocean starting at the fissure on Hawaii’s eastern point. MISR uses it’s unique, nine-angle view to calculate plume height. This image is from one of MISR’s forward pointing cameras. The plume height is relatively low, meaning that gas and ash are staying near the ground, potentially causing health risks from poor air quality downwind.

Read more:


Ash from Kilauea Eruption Viewed by NASA’s MISR on NASA JPL’s Photojournal


When volcanoes erupt, ASTER turns its attention to documenting the changes to the landscape as they happen. ASTER is uniquely capable of turning to see areas where volcanoes are erupting in very high resolution (between 15 in the thermal bands – 90 meter spatial resolution in the visible light spectral bands).

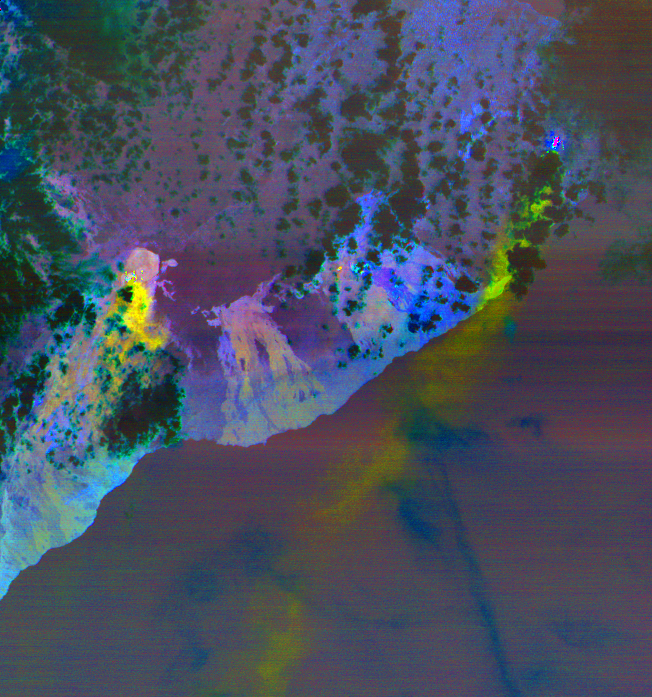
As Hawaii’s Kilauea continues to erupt, ASTER continues to monitor the eruption from space. This image from May 6, 2018 shows the sulfur dioxide being released from the volcano in yellow and yellow-green.

Read more:

Satellite View of Kilauea Eruption from NASA JPL


The tiny Aleutian island of Bogoslof in Alaska, erupting regularly since December 2016, produced fresh activity on Sunday, May 28, 2017. Bogoslof is a stratovolcano fueled by the subduction of the Pacific Plate under the North American Plate and forms part of the larger Aleutian Arc, which includes more than 60 volcanoes on the Aleutian Islands and the Aleutian Range on the Alaska mainland. Previous to its recent period of activity, Bogoslof had last erupted in 1992, and its above-water surface area was a mere 0.11 square miles (0.29 square kilometers). As of March 11, the most recent data available, the area of the island had tripled to 0.38 square miles (0.98 square kilometers). The event on May 28 produced an ash cloud that reached 40,000 feet (12 km) in altitude, causing the Alaskan Volcano Observatory to issue a red alert for air travel in the area. Volcanic ash can cause major damage to aircraft engines, and the region is close to several major air routes between North America and Asia.

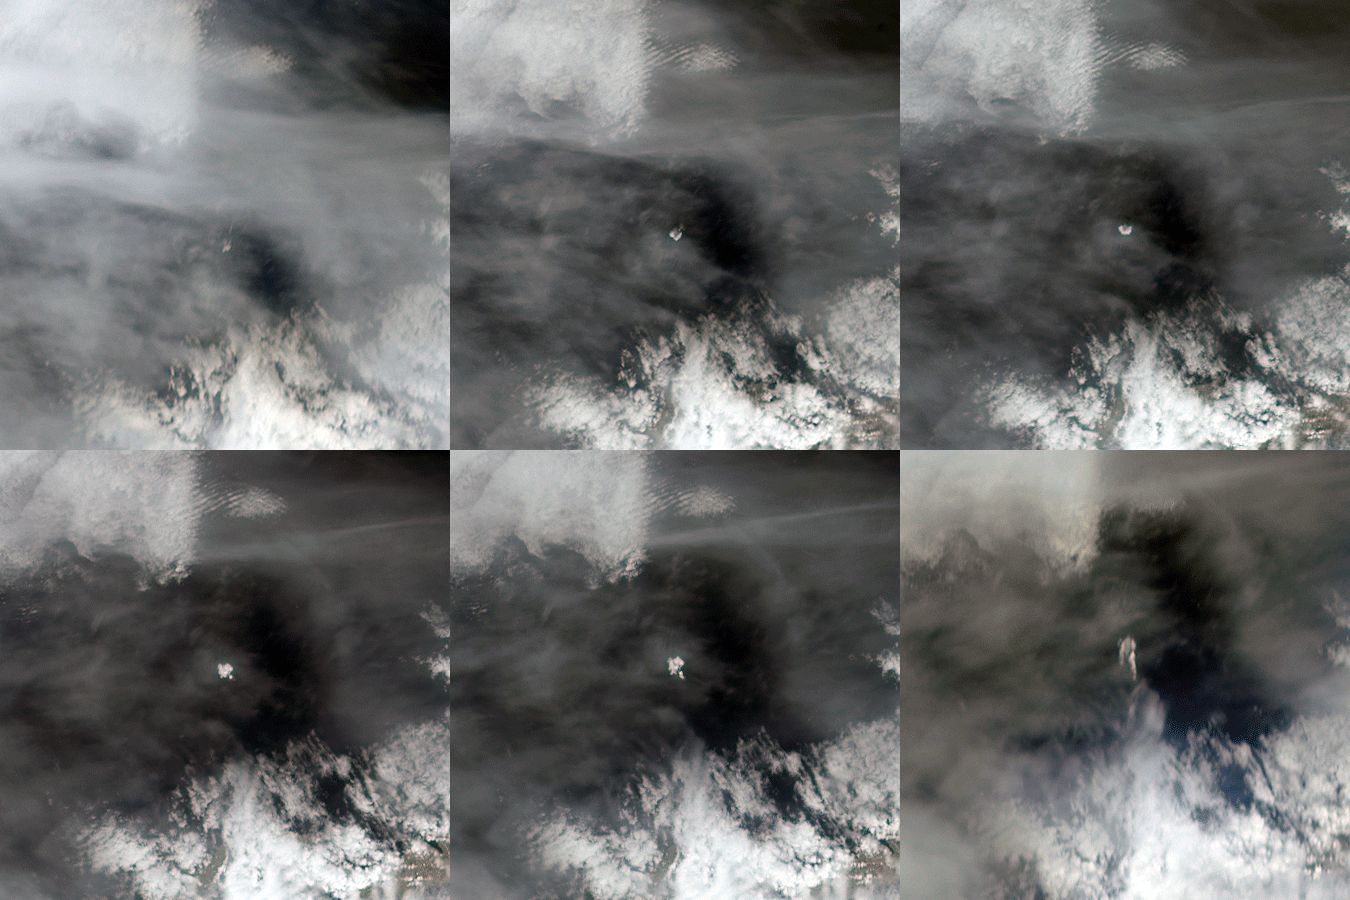
On May 28, 2017, at approximately 2:23 p.m. local time, NASA’s Terra satellite passed over Bogoslof, less than 10 minutes after the eruption began. MISR has nine cameras that view Earth at different angles. It takes slightly less than seven minutes for all nine cameras to view the same location on Earth. On the left, an animation made from the images from the nine MISR cameras, captured between 2:19 and 2:26 p.m., demonstrates how the angled views give a glimpse of the underside of the growing plume of volcanic ash, showing the eruption column widening into the cloud at the top.

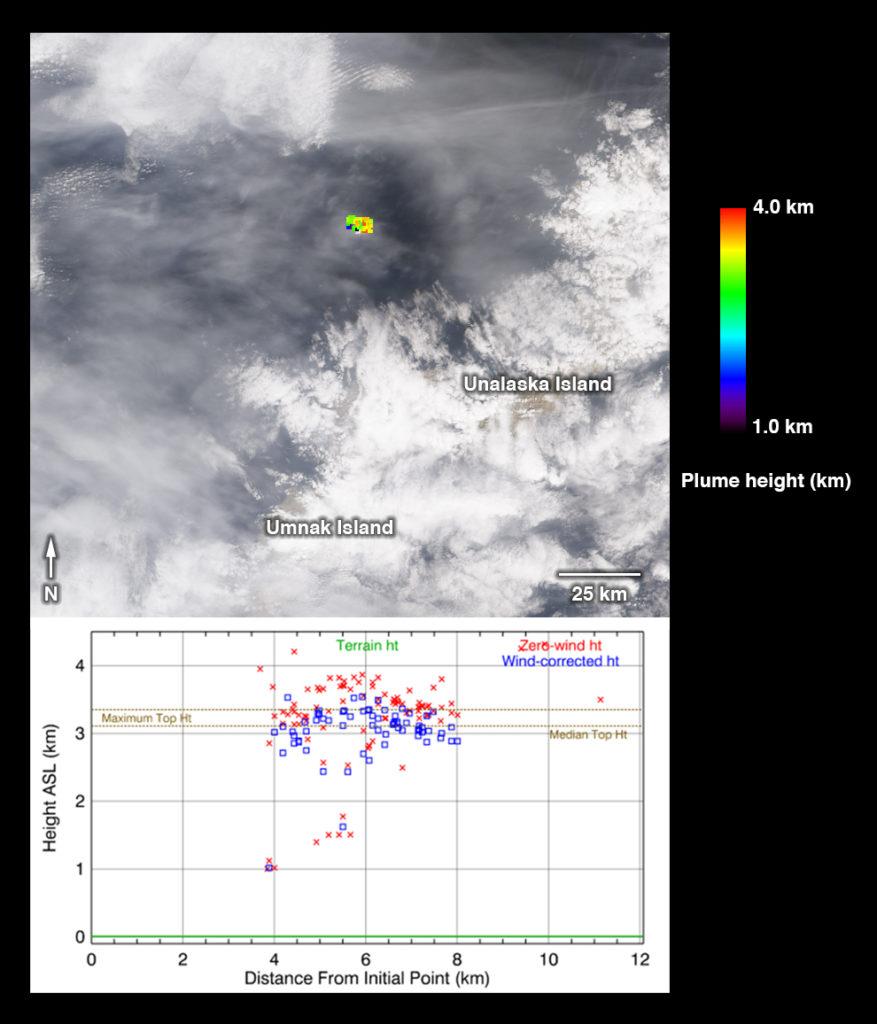
Data from MISR’s nine cameras can also be used to calculate the height of the plume, based on the apparent movement of the cloud from one camera to another. On the right, a map of plume height is plotted over the downward-looking image. The top of the cloud was approximately 10,000 feet (3 kilometers) high at this time. Below the image is a scatterplot of the heights, with blue points representing heights corrected by the northwesterly winds reported by the Alaskan Volcano Observatory during the eruption, and red points representing uncorrected heights. Lower points at either side of the plume represent retrievals of the eruption column.

These data were captured during Terra orbit 92786. The stereoscopic analysis was performed using the MISR INteractive eXplorer (MINX) software tool, which is publicly available through the Open Channel Foundation at https://www.openchannelsoftware.com/projects/MINX. Other MISR data are available through the NASA Langley Research Center; for more information, go to https://eosweb.larc.nasa.gov/project/misr/misr_table. MISR was built and is managed by NASA’s Jet Propulsion Laboratory in Pasadena, California, for NASA’s Science Mission Directorate in Washington, D.C. The Terra spacecraft is managed by NASA’s Goddard Space Flight Center in Greenbelt, Maryland. The MISR data were obtained from the NASA Langley Research Center Atmospheric Science Data Center in Hampton, Virginia. JPL is a division of the California Institute of Technology in Pasadena.

Credit: NASA/GSFC/LaRC/JPL-Caltech, MISR Team, article by Abbey Nasten

caspiansea_amo_2016158

Does Dust Affect Water Levels of the Caspian Sea

June 10, 2016

Dust storms over the Caspian Sea lead to increased evaporation and a drop in lake level according to new research using observations of dust collected by instruments on several satellites including the Moderate Imaging Spectroradiometer (MODIS ) and the Multi-angle Imaging Spectroradiometer (MISR) on Terra.


ruapehu_ast_2016111

A Satellite Eye on Mount Ruapehu

June 5, 2010

Mount Ruapehu is one of New Zealand’s most active volcanoes and most visited, dotted with skiers and snowboarders along its slopes.  When it erupts lahars, flows of volcanic debris and sediment, can have devastating impacts, prompting geologists to regularly monitor the volcano, using the Advanced Spaceborne Thermal Emission and Reflection Radiometer on NASA’s Terra satellite.