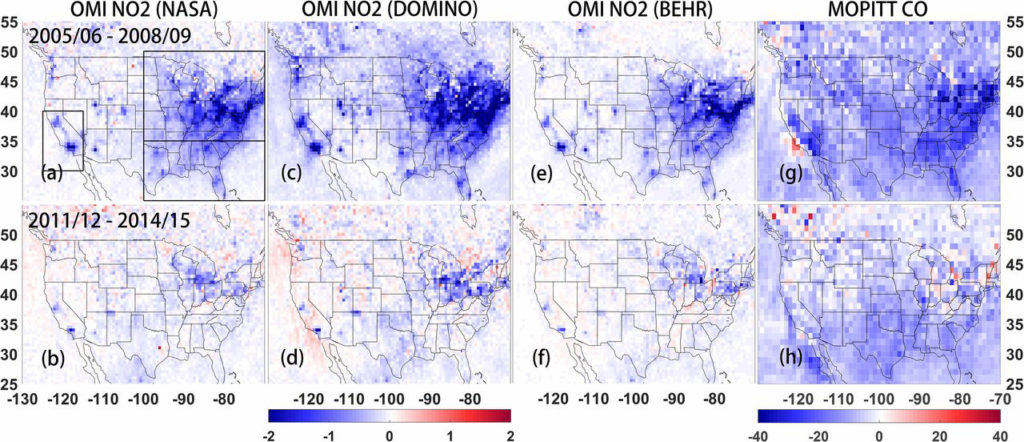
Difference of mean tropospheric OMI NO2 columns from 2005–2006 to 2008–2009, and from 2011–2012 to 2014–2015. The unit is 1015 mole/cm2. (G and H) same as A–F, but for MOPITT surface layer CO measurements with unit ppb (parts per billion).
A recent article published in PNAS points out that efforts to reduce nitrogen dioxide and carbon monoxide emissions between 2011 – 2015 have slowed in the United States, despite previous estimates that emissions were decreasing. These “bottom-up” estimates used ground-based measurements, inventories and models to predict these smog-producing emissions. However, when viewed from above, through satellite data from MOPITT and OMI, both nitrogen dioxide and carbon monoxide levels have not decreased.
Researchers concluded that emissions, especially for nitrogen dioxide, have not decreased as thought because of vehicle and industrial emissions. Industrial and construction equipment emissions are growing, while heavy duty truck diesel emissions may have been overlooked in ground-based measurements. Car emissions also continue to be a pollution source, but are now contributing a smaller proportion of total emissions.
One thing is certain, that viewing from above gives scientists the opportunity to see the whole United States, instead of relying on site specific ground based measurements.
Read more about it in the news:
Los Angeles Times: Slowdown in emissions reductions could explain stalled progress on smog, study finds
Bloomberg: Your air isn’t getting as clean as the EPA said it is
Associated Press (on Tampa Bay Times website): America’s air isn’t getting cleaner as fast as it used to

