

Offshore from Argentina, spring is in bloom. Massive patches of floating phytoplankton colored the ocean in November 2013. These microscopic, plant-like organisms are the primary producers of the ocean, harnessing sunlight to nourish themselves and to become food for everything from zooplankton to fish to whales.
The Moderate Resolution Imaging Spectroradiometer (MODIS) on NASA’s Terra satellite captured this natural-color image on November 26, 2013. Read more
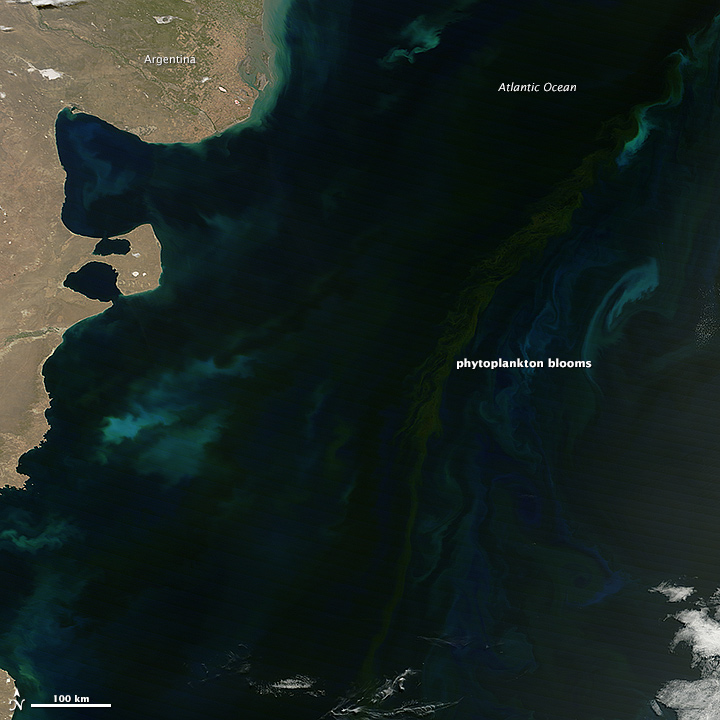
NASA image by Jeff Schmaltz, LANCE/EOSDIS Rapid Response. Caption by Michael Carlowicz.
