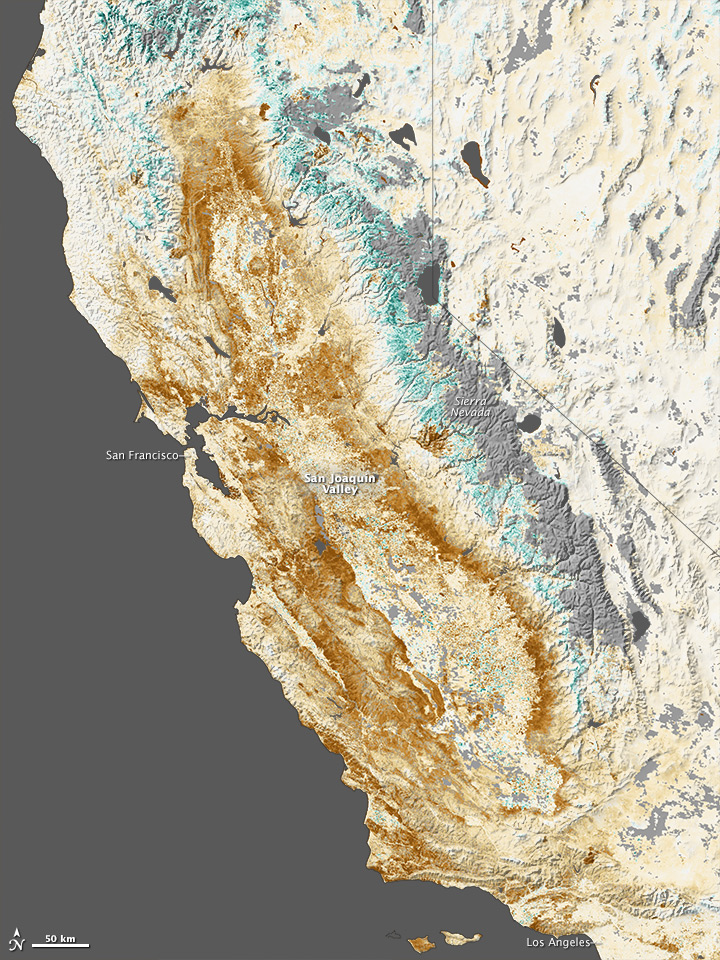
Persistent dry weather has grown more worrisome in the American West, with nearly two thirds of the region experiencing some level of drought. By most measures, the state of California is suffering through the worst of it. The effects of the dry spell are visible in the mountains, where snow pack is lacking, and now in the vegetation cover on the landscape. Nearly all of California was in a state of extreme drought at the end of January 2014. The past three months (November to January), six months (since August) and twelve months were all the driest periods in California since record-keeping started in 1885. From February 1, 2013, through January 31, 2014, a statewide average of 6.97 inches (177.04 millimeters) of rain fell; the norm is 22.51 inches (571.75 millimeters). The map above shows the impact of drought on California’s farms, forests, and wild lands. Based on data from the Moderate Resolution Imaging Spectroradiometer (MODIS) on NASA’s Terra and Aqua satellites, the map contrasts plant health from January 17 to February 1, 2014, against average conditions for the same period over the past decade. Read more
- NASA Earth Observatory image by Jesse Allen, Earth Observatory, using data provided by Inbal Reshef, Global Agricultural Monitoring Project. Caption by Mike Carlowicz.


