Tag: Carbon Cycle and Ecosystems

Carbon Cycle and Ecosystems

Fall colors on eastern seaboard as seen by Terra MODIS

NASA images by Jeff Schmaltz, LANCE/EOSDIS Rapid Response.

It’s time for the annual Fall color display across part of the Northern Hemisphere.  The Moderate Resolution Imaging Spectroradiometer (MODIS) on NASA’s Terra satellite captured the colorful changing foliage on October 11, 2015. As temperatures drop and sunlight fades, the leaves begin to change colors. This image was recently featured on NASA’s Earth Observatory.

global.fallA recent study published in Nature now estimates that there are 3.04 trillion trees on Earth, a number that is almost 8 times higher than previous estimates

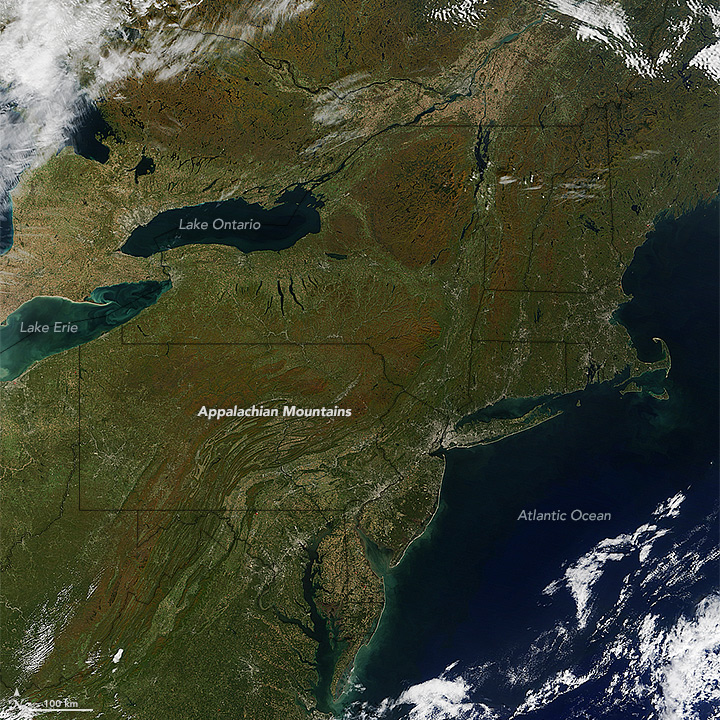
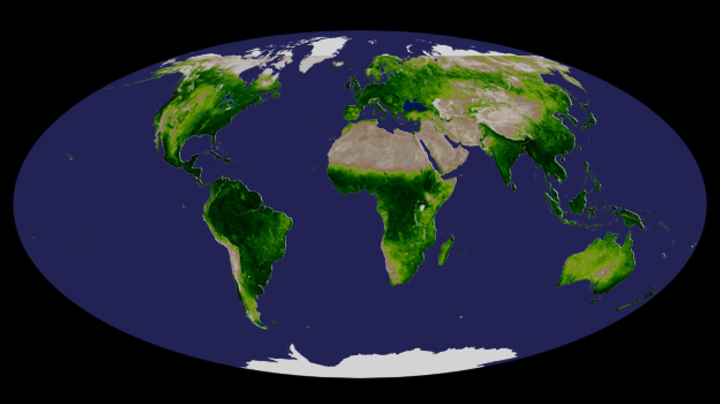
Scientists rely primarily on remotely-sensed to obtain estimates of global tree populations. Satellites provide the best opportunity to achieve a global perspective, but their view of tree forest canopies from above tends to obscure individual trees and shorter trees, making it difficult to make accurate estimates. In addition, satellites are limited by their spatial resolution, not every tree is as obvious as a Redwood alone in a field. The Redwood example also points to another complication, the definition of a tree, which for most studies, including the one in Nature, is vegetation with woody stems 10 cm in diameter or larger at chest height. Thus, counting trees is a difficult process because they can vary in size and can hide beneath the canopy of larger trees, as well as be too small to be seen in satellite images.

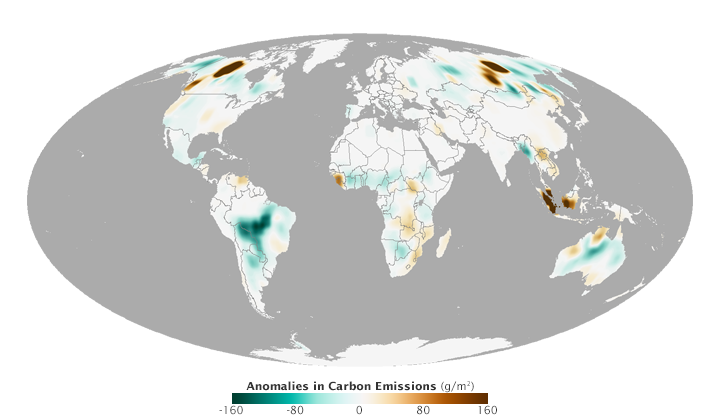
To get a better estimate of the actual number of trees on Earth, researchers combined data from multiple vegetation indexes, including the Enhanced Vegetation Index (EVI) from the Moderate Imaging Spectroradiometer (MODIS) onboard Terra, with actual tree counts for over 430,000 hectares from 14 different biomes on Earth (there is an estimated 4 million hectares of forested land on Earth). Merging the ground measurements and applying them to the different areas of land cover visible through satellite images resulted in the more accurate estimate of tree population possible with surprisingly large results.

Read more on nature.com

globalcarbon_gis_2014

NASA Earth Observatory map by Joshua Stevens and Jesse Allen, using data from the Global Fire Assimilation System (GFAS) and the State of the Climate in 2014 report. Caption by Adam Voiland.

On Earth, there is always something burning. On a typical day in August, the Moderate Resolution Imaging Spectroradiometers (MODIS) on NASA’s Aqua and Terra satellites detect approximately 10,000 active fires, as well as huge swaths of freshly charred land in ecosystems ranging from boreal forests to savanna to tropical forests.

In order to determine how much carbon dioxide and other pollutants all these fires contribute to the atmosphere in a given year, scientists have developed computer models that combine satellite observations of burned area and active fires together with information about vegetation, fuel loads, and other details. Data produced by two computer modeling efforts—the Global Fire Assimilation System (GFAS) and the Global Fire Emissions Database (GFED)—were highlighted in NOAA’s 2014 State of the Climate report, published in the Bulletin of the American Meteorological Society. Read more

canada_tmo_2015180

NASA image courtesy Jeff Schmaltz, LANCE/EOSDIS MODIS Rapid Response Team at NASA GSFC. Caption and image cropping by Adam Voiland.

The 2015 fire season got off to an unusually early start in Canada when blazes broke out in the Northwest Territories, British Columbia, and Alberta in late May. As the season has progressed, the air in western Canada—as well as large swaths of the United States—grew gray and hazy with smoke.

Beginning on June 28, a sharp trough in the jet stream sent a river of smoke streaming south into the United States. By June 29, smoke darkened the skies over much of Saskatchewan, Alberta, Manitoba, North Dakota, South Dakota, Minnesota, and Iowa.

On June 29, 2015, the Moderate Resolution Imaging Spectroradiometer (MODIS) on NASA’s Terra satellite captured this image of smoke from hundreds of wildfires in western Canada. Read more

australia_tmo_2014280

NASA image courtesy Jeff Schmaltz, LANCE MODIS Rapid Response Team at NASA GSFC. Caption by Adam Voiland, with information from Daniel Lindsey (NOAA) and Rick McRae (Australian Capital Territory Emergency Services Agency).

The intense bushfires that strike southern Australia in the summer usually attract the most headlines, but the country’s largest and most frequent blazes actually occur in northern Australia in the spring. In fact, in terms of sheer area burned, satellite observations show that over 98 percent of large fires in Australia occur well outside of densely populated southeastern and southwestern parts of the country.

A fire that began burning in Northern Territory on September 10, 2014, offers a prime example of just how expansive fires from this part of the continent can become. After racing through grasslands for just a few weeks, the fire had charred an area about the size of Massachusetts by October 8, 2014.

The Moderate Resolution Imaging Spectroradiometer (MODIS) on NASA’s Terra satellite captured this sequence of images showing the progression of the fire.  Read more