Tag: Earth’s Surface and Interior

Earth’s Surface and Interior

Peru_tmo_2014148

Ocean clouds meet the coastal desert in dramatic fashion on the coast of Peru, outlining the inland topography with precision. This image, acquired by the Moderate Resolution Imaging Spectroradiometer (MODIS) on NASA’s Terra satellite on May 28, 2014, illustrates the balance of nature’s extremes: dry versus wet and high versus low. Read more

NASA image courtesy Jeff Schmaltz, LANCE/EOSDIS MODIS Rapid Response Team at NASA GSFC. Caption by Holli Riebeek.

ubinas_ast_2014118

Despite a recent decline in earthquakes, Ubinas Volcano erupted another ash plume on April 28, 2014. The Advanced Spaceborne Thermal Emission and Reflection Radiometer (ASTER) collected this false-color view of the area on the same day. Red in the image indicates vegetation. Read more

NASA Earth Observatory image by Jesse Allen and Robert Simmon, using data from the NASA/GSFC/METI/ERSDAC/JAROS, and U.S./Japan ASTER Science Team. Caption by Robert Simmon.

NASA image by Robert Simmon with ASTER data. Caption by Holli Riebeek with information and review provided by David Mayer, Robert Simmon, and Michael Abrams.

A satellite image is more than a photo. It is a picture of the amount and type of energy reflected or emitted by the Earth and recorded by a satellite instrument. There are many ways to combine those measurements to create an image, and each combination provides different insights.

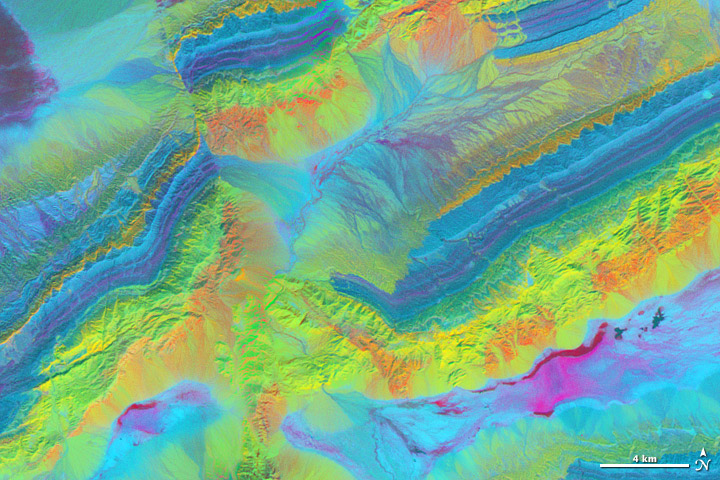
The spectacular exposed geology of northwestern China offers an ideal landscape for illustrating how satellite measurements can identify minerals from afar. In satellite imagery, this area has three different sedimentary rock layers that are visible as rainbow stripes on a series of ridges. The Piqiang Fault has split the ridgeline, so the colored layers are offset by about three kilometers (two miles). All of the images on this page were made from data acquired on February 24, 2005, by the Advanced Spaceborne Thermal Emission and Reflection Radiometer (ASTER) on NASA’s Terra satellite. Read more

NASA image by Robert Simmon with ASTER data. Caption by Holli Riebeek with information and review provided by David Mayer, Robert Simmon, and Michael Abrams.

NASA Earth Observatory image by Jesse Allen and Robert Simmon, using data from NASA/GSFC/METI/ERSDAC/JAROS, and U.S./Japan ASTER Science Team. Caption by Adam Voiland.

Though a small nation, Kuwait has an outsized role in oil production. The country has an estimated 94 billion barrels of proven oil reserves, about 9 percent of the world’s total. The oldest and largest of Kuwait’s oil fields-the Greater Burgan field in southeastern Kuwait-produces about 1.6 million barrels of oil a day.

The Greater Burgan is comprised of three smaller fields: Burgan, Magwa, and Ahmadi. The first oil well was installed in Burgan in 1938. Oil was discovered at the Magwa field in 1950 and at the Ahmadi field in 1952. The Advanced Spaceborne Thermal Emission and Reflection Radiometer (ASTER) on NASA’s Terra satellite captured this image of a portion of the Burgan field on September 27, 2009. Read more

NASA Earth Observatory image by Jesse Allen and Robert Simmon, using data from NASA/GSFC/METI/ERSDAC/JAROS, and U.S./Japan ASTER Science Team. Caption by Adam Voiland.

NASA image courtesy of the LANCE/EOSDIS MODIS Rapid Response Team at NASA GSFC. Caption by Adam Voiland. NASA image courtesy of the LANCE/EOSDIS MODIS Rapid Response Team at NASA GSFC. Caption by Adam Voiland.

The Finger Lakes-a group of long, roughly parallel lakes in upstate New York-got their name for obvious reasons. On a map, the narrow lakes look similar to outstretched digits. Seneca and Cayuga-the two largest Finger Lakes-are among the deepest lakes in North America. Lake Cayuga descends about 435 feet (133 meters) at its deepest point-putting it about 53 feet (16 meters) below sea level.

On May 6, 2013, the Moderate-resolution Imaging Spectroradiometer (MODIS) on NASA’s Terra satellite acquired this true-color image of the Finger Lakes. Read more