
Image Credit: NASA/GSFC/METI/ERSDAC/JAROS, and U.S./Japan ASTER Science Team
Like the sun, Earth emits energy, yet this energy cannot be seen. Instead, it can be felt as heat because it is emitted in the thermal infrared wavelength range of the electromagnetic spectrum. While some energy in the electromagnetic spectrum can be seen in the form of light, other energy can only be felt as heat. For example, if you stand next to an oven or hover your hand over a hot burner you can feel the heat being emitted without directly touching either appliance. The strength of the energy emitted depends on both the temperature of the surface and how efficiently it can emit radiation, known as its emissivity.
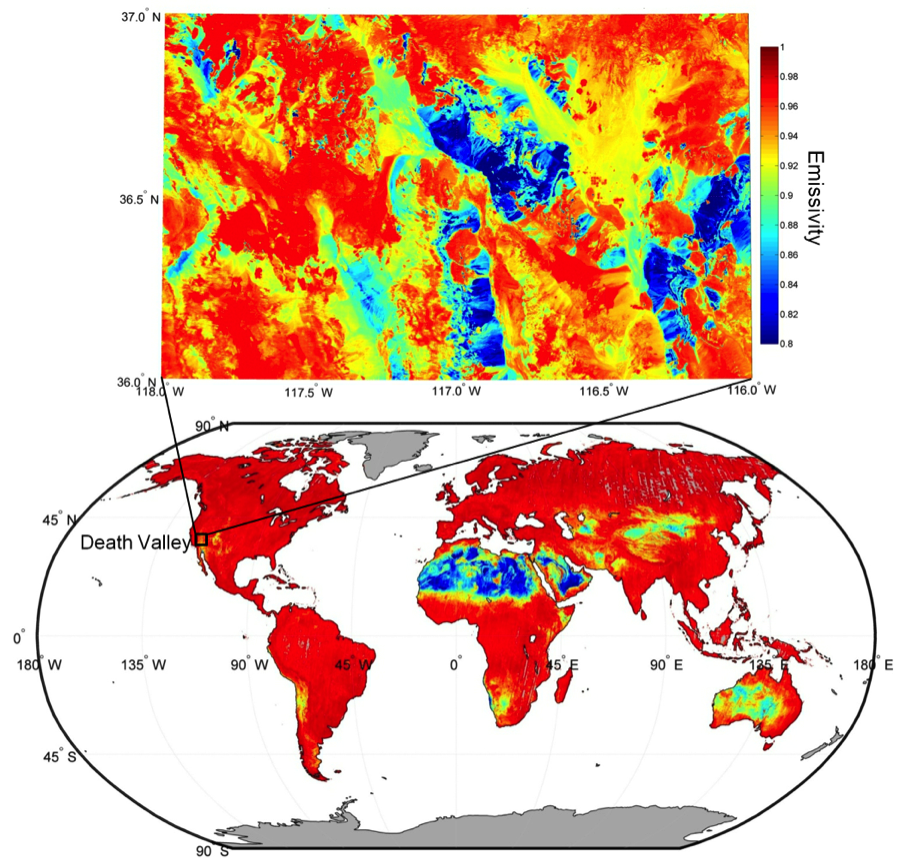
The emissivity of most natural Earth surfaces is a unitless quantity and ranges between approximately 0.6 and 1.0, but surfaces with emissivities less than 0.85 are typically restricted to deserts and semi-arid areas. Vegetation, water and ice have high emissivities, above 0.95 in the thermal infrared wavelength range.
Instruments sensitive to thermal infrared radiation on-board NASA’s Earth Observing Satellites are designed to calculate Earth’s emissivity. The Advance Spaceborne Thermal Emission and Reflection Radiometer (ASTER) on-board Terra is one of these instruments. It calculates emissivity at 90 m spatial resolution for five different wavelengths in the thermal infrared spectrum. Scientists at NASA’s Jet Propulsion Laboratory in Pasadena, California produced the most detailed global map of emissivity by compositing millions of clear-sky images from ASTER, collected since its launch in 2000. This global map is the ASTER Global Emissivity Database (ASTER GED). ASTER GED is approximately 100 times more detailed than any other previous emissivity map produced by NASA.
Emissivity, unlike surface temperature, is an intrinsic property of the surface and does not depend on the angle of the sun in relationship to Earth or on local weather conditions. Instead emissivity variations occur due to land cover and use changes, as well as, the mineral composition of the land’s surface.
In the image, red areas (>0.95) have high emissivity and are covered with large amounts of vegetation, water, or ice. Blue areas (<0.8) have low emissivity and are indicative of quartz sands, which are found in arid regions such as the Sahara Desert in northern Africa. Transition areas from desert regions to more heavily vegetated regions, such as in the Sahel in Africa, appear green and yellow.
ASTER GED is a global, 90m spatial resolution emissivity map of the Earth’s non-frozen land surfaces at five different wavelengths in the thermal infrared spectrum. ASTER along with the Moderate Resolution Imaging Spectroradiometer (MODIS) on-board both Terra and Aqua and the Atmospheric Infrared Sounder (AIRS) on-board Aqua measure thermal infrared radiation. Therefore, the high resolution ASTER GED can be used to calibrate and validate these instruments coarser resolution estimates of emissivity at the kilometer-scale. ASTER GED is also being used for improving estimates of Earth’s surface temperature, atmospheric water vapor, and the accuracy of climate models, which currently have large uncertainties in their use of emissivity information.
Resources:
Jet Propulsion Laboratory Photojournal. (2014, October 20). NASA Spacecraft Maps Earth’s Global Emissivity. accessed October 23, 2014.
Land Processes Distributed Active Archive Center. (2014, April 2). ASTER Global Emissivity Database (GED) Product Release. Accessed October 7, 2014.
Joint Emissivity Database Initative (JEDI) Accessed October 7, 2014
ASTER-GED. Accessed October 23, 2014

