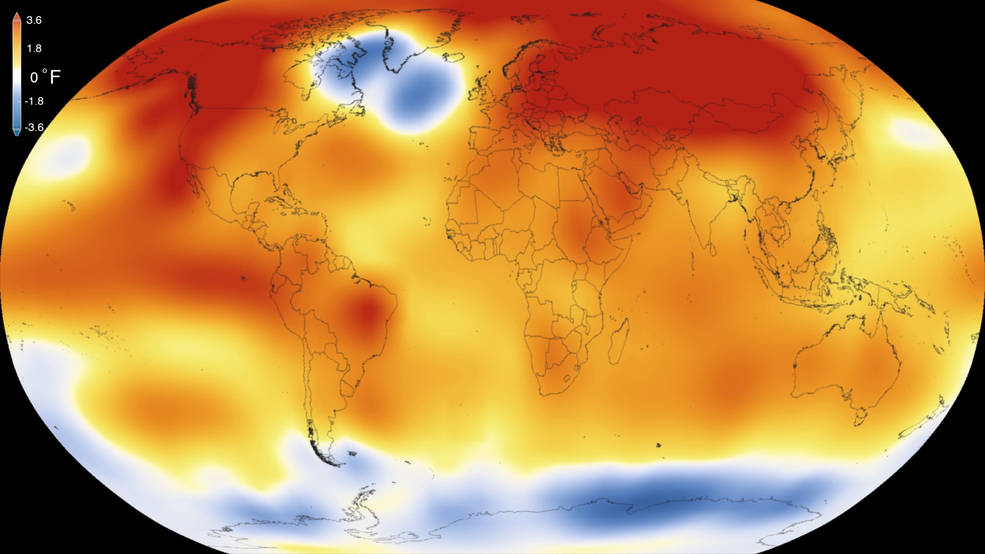
2015 was the warmest year since modern record-keeping began in 1880, according to a new analysis by NASA’s Goddard Institute for Space Studies. The record-breaking year continues a long-term warming trend — 15 of the 16 warmest years on record have now occurred since 2001. Credits: Scientific Visualization Studio/Goddard Space Flight Center
2015 was the hottest year ever recorded*, but what does Terra have to do with it?
On January 20th, 2016, scientists from NASA’s Goddard Institute for Space Studies (GISS) and National Oceanic and Atmospheric Administration (NOAA) released their analysis based on data gathered on Earth’s surface temperatures. There are two primary sources of data, ground measurements and satellite. While GISS and NOAA studies relied on surface-based measurements, data from satellite instruments, such as those on-board NASA’s Terra satellite are critical for better understanding of global temperatures as a function of time.
“The length and quality of the Terra data record makes it well suited as a check of the global temperature results and can help guide choices on ways to process the surface data,” according the Kurt Thome, Terra project scientist. Three of the Terra sensors have data that are well suited to serve as a validation source, allowing the researchers and scientists to go back and check their data. If surface and satellite measurements are the same, then the scientists responsible for creating the data products can conclude that the product is accurate. This increases confidence in the satellite data’s accuracy as well as verifying that the ground measurements are also accurate. When accurate data is put into the climate models the accuracy of the models is increased.
The Moderate Imaging Spectroradiometer (MODIS) measures Land Surface Temperatures (LST) and Sea Surface Temperatures (SST). There are two MODIS instruments in orbit, one on Terra and the other on Aqua. While the data analyzed in the NASA/NOAA report relies primarily on data from ground stations, the data gathered by MODIS can help “fill in the blanks” of areas where there are not many ground observations available. The data from MODIS, not only can be used to verify that ground instruments are working correctly, but it can also be used to add values to the climate models, that may otherwise be left blank.
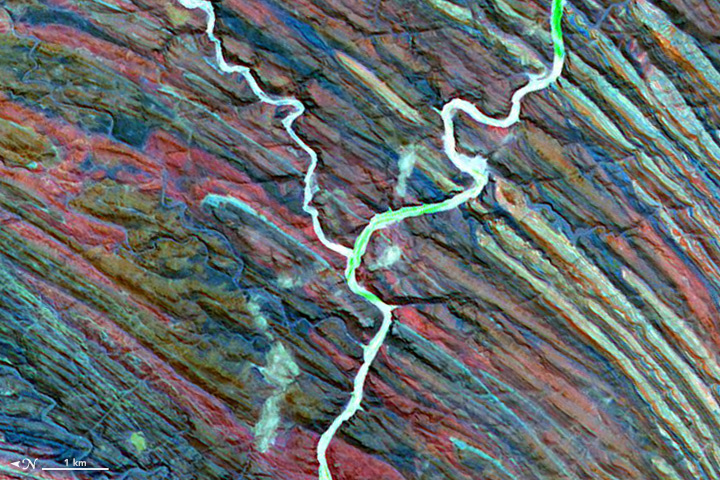
The Advanced Spaceborne Thermal Emission and Reflection Radiometer (ASTER) also on NASA’s Terra Satellite, can sense temperature emissions, but at a higher resolution than MODIS. In fact, ASTER is responsible for the highest resolution global emissivity database. While emissivity isn’t the same as land surface temperature the two are linked because how well a material emits combined with its temperature determines how much energy is given off. When temperatures rise, areas that were once vegetated can become arid causing a change in the emissivity and further changing how energy is distributed between vegetated and arid regions. ASTER, with its narrow swath and high resolution, required several years to create its global emissivity product. Combining the ASTER results with the daily MODIS measurements allows MODIS scientists to retrieve daily LST.
Finally, Clouds and the Earth’s Radiant Energy System (CERES) measures both emitted energy from the earth and solar-reflected energy. Combining these data with the amount of incident solar energy allows CERES scientists to do a full accounting of the Earth’s energy budget. Less reflected energy and greater emitted energy implies a warming planet. CERES, through measuring the amount of energy in the form of heat that is coming from Earth, can be used to validate ground measurements from weather stations. Conversely the ground stations can validate the measurements taken by CERES. Like MODIS and ASTER, this helps increase confidence in the current climate models.
While satellite monitoring of the Earth is relatively new compared the hundreds of years of historic records, satellite data is increasingly being used to help validate the most recent additions to the historic record. Satellite data allows scientists to get global coverage and increase confidence in the data that feeds climate models. Even though Earth is warming, satellite data are better equipped to model the increased temperatures and help citizens and policymakers understand the implications.
Read the press release from NASA GISS and NOAA
Read more on NASA’s Earth Observatory
*modern record keeping began in 1880.


