Tag: Climate Variability and Change

Climate Variability and Change

NASA Earth Observatory image by Jesse Allen, Earth Observatory, using data provided by Inbal Reshef, Global Agricultural Monitoring Project. Caption by Mike Carlowicz.

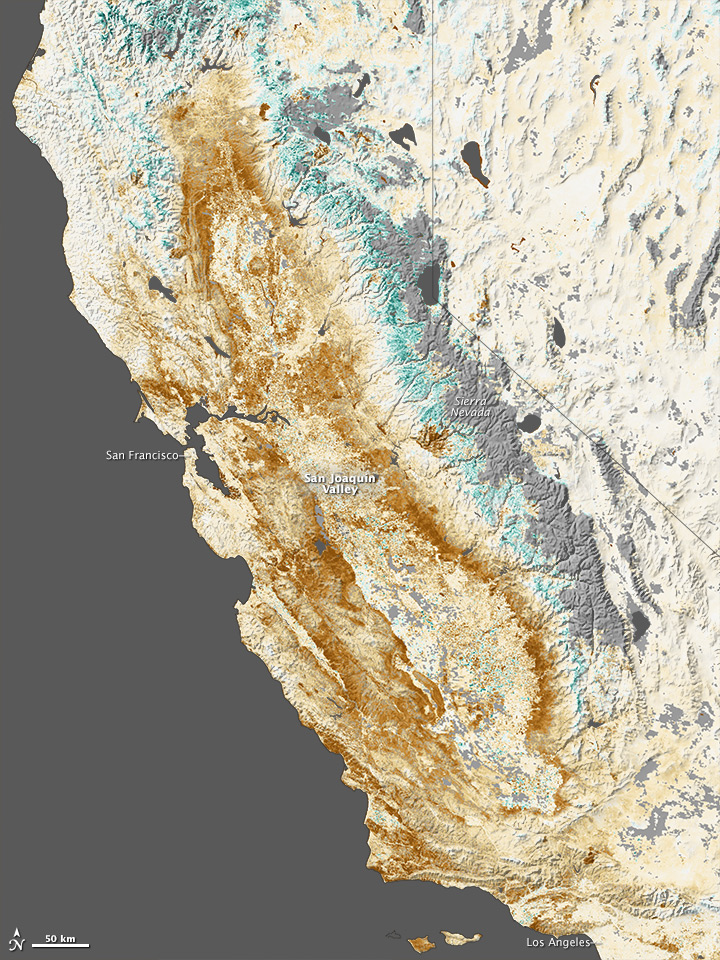
Persistent dry weather has grown more worrisome in the American West, with nearly two thirds of the region experiencing some level of drought. By most measures, the state of California is suffering through the worst of it. The effects of the dry spell are visible in the mountains, where snow pack is lacking, and now in the vegetation cover on the landscape. Nearly all of California was in a state of extreme drought at the end of January 2014. The past three months (November to January), six months (since August) and twelve months were all the driest periods in California since record-keeping started in 1885. From February 1, 2013, through January 31, 2014, a statewide average of 6.97 inches (177.04 millimeters) of rain fell; the norm is 22.51 inches (571.75 millimeters). The map above shows the impact of drought on California’s farms, forests, and wild lands. Based on data from the Moderate Resolution Imaging Spectroradiometer (MODIS) on NASA’s Terra and Aqua satellites, the map contrasts plant health from January 17 to February 1, 2014, against average conditions for the same period over the past decade. Read more

NASA Earth Observatory image by Jesse Allen, Earth Observatory, using data provided by Inbal Reshef, Global Agricultural Monitoring Project. Caption by Mike Carlowicz.

ASTER satellite image of the 2014 Sochi Winter Olympic Games Coastal Cluster, the site for arena sports and the opening and closing ceremonies. Image credit: NASA/GSFC/METI/ERSDAC/JAROS, and U.S./Japan ASTER Science Team

If Satellites won gold metals, Terra may win for most striking view of the 2014 Winter Olympics in Sochi Russia. Using the Advanced Spaceborne Thermal Emissions and Reflection Radiometer (ASTER) the mountains of the Rosa Khutar ski resort near Sochi, Russia. Snow is shown as white, while vegetation is red and buildings are gray. At the bottom of the image the Black Sea appears black. read more from JPL news

ASTER satellite image of the 2014 Sochi Winter Olympic Games Coastal Cluster, the site for arena sports and the opening and closing ceremonies. Image credit: NASA/GSFC/METI/ERSDAC/JAROS, and U.S./Japan ASTER Science Team

Or see what these other news sources had to say:
Washington Post

Science World Report

Guardian

Space Coast Daily

Wall Street Journal

NASA Earth Observatory images by Jesse Allen and Jeff Schmatltz, using data from the Land Processes Distributed Active Archive Center (LPDAAC) and the LANCE/EOSDIS Rapid Response. Caption by Adam Voiland.

While much of the continental United States endured several cold snaps in January 2014, record-breaking warmth gripped Alaska. Spring-like conditions set rivers rising and avalanches tumbling.

This map depicts land surface temperature anomalies in Alaska for January 23-30, 2014. Based on data from the Moderate Resolution Imaging Spectroradiometer (MODIS) on NASA’s Terra satellite, the map shows how 2014 temperatures compared to the 2001-2010 average for the same week. Areas with warmer than average temperatures are shown in red; near-normal temperatures are white; and areas that were cooler than the base period are blue. Gray indicates oceans or areas where clouds blocked the satellite from collecting usable data. Read more

NASA Earth Observatory images by Jesse Allen and Jeff Schmatltz, using data from the Land Processes Distributed Active Archive Center (LPDAAC) and the LANCE/EOSDIS Rapid Response. Caption by Adam Voiland.

NASA Earth Observatory image by Jesse Allen and Robert Simmon, using data from the Land Atmosphere Near real-time Capability for EOS (LANCE). Caption by Adam Voiland.

A large winter storm swept through the southeastern United States in January 2014, dropping snow and ice on an area unaccustomed to dealing with winter weather.

While clouds still covered most of the area affected by the storm when the Terra satellite passed over on January 29, 2014, the Moderate Resolution Imaging Spectroradiometer (MODIS) on board captured this view of snow on the ground in parts of northern Georgia, northern South Carolina, eastern Tennessee, and western North Carolina. According to the National Weather Service, the storm dropped up to 9 inches (23 centimeters) of snow in parts of North Carolina, 4 inches (10 centimeters) in parts of South Carolina and Georgia, and 2 inches (5 centimeters) in parts of Tennessee. Atlanta received 2.6 inches (6.6 centimeters) of snow. Many areas also received significant amounts of freezing rain and sleet. Read more

NASA Earth Observatory image by Jesse Allen and Robert Simmon, using data from the Land Atmosphere Near real-time Capability for EOS (LANCE). Caption by Adam Voiland.

NASA images courtesy LANCE/EOSDIS MODIS Rapid Response Team at NASA GSFC. Caption by Holli Riebeek.

2013 was a dry year for California, but it has nothing on 2014 so far. January is on track to be California’s driest on record, and since the state receives half of its precipitation between December and February, it appears that the 2013-2014 water year could be the driest on record too. With that possibility in view, California governor, Edmund G. Brown, Jr. declared a state of emergency on January 17, urging Californians to conserve water.

From brown landscapes to the bare mountains, California is clearly dry in this view from the Moderate Resolution Imaging Spectroradiometer (MODIS) on NASA’s Terra satellite, taken on January 18, 2014. The lower image, taken on January 18, 2013, contrasts last year’s drought conditions with the extreme conditions currently in place. Read more

NASA images courtesy LANCE/EOSDIS MODIS Rapid Response Team at NASA GSFC. Caption by Holli Riebeek.