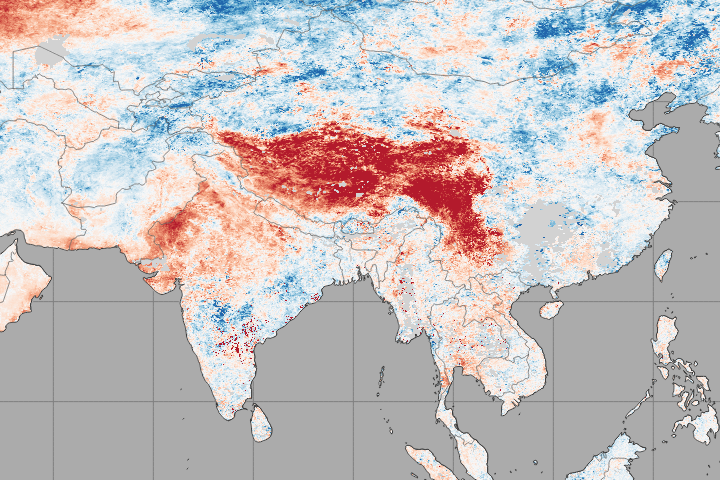
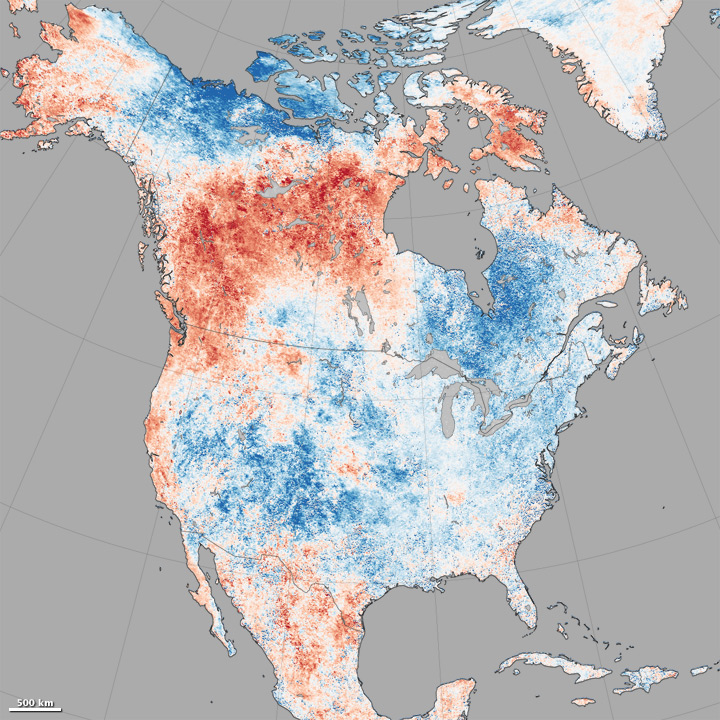
Tag: Climate Variability and Change

Climate Variability and Change

india_lsta_20140602-09

In the first half of June 2014, news accounts described an extreme heatwave in India, as well as the late and somewhat weak arrival of the seasonal monsoon. Air temperatures in New Delhi climbed as high as 48° Celsius (118° Fahrenheit) and stayed above 43°C (110°F) for seven days. Satellite data offer some insights on what was happening on the ground.

The maps above show land surface temperature (LST) anomalies for southern Asia from June 2–9 and June 10–17, 2014. LST anomalies are not absolute temperatures; instead, they show how much the land surface was heated above or below the average. The darkest reds show areas where the ground was as much as 12°C (22°F) above the norm from 2001–2010; blues show areas that were below normal; and grays depicts areas with incomplete data (usually due to excessive cloud cover). Read more

NASA images by Jeff Schmaltz, LANCE/EOSDIS Rapid Response. Caption by Michael Carlowicz.

In early November 2013, a large iceberg separated from the front of Antarctica’s Pine Island Glacier. It thus began a journey across Pine Island Bay, a basin of the Amundsen Sea. The ice island, named B31, will likely be swept up soon in the swift currents of the Southern Ocean, though it will be hard to track visually for the next six months as Antarctica heads into winter darkness.

Over the course of five months in Antarctic spring and summer, the Moderate Resolution Imaging Spectroradiometer (MODIS)—an instrument on NASA’s Terra and Aqua satellites—captured a series of images of ice island B31. Read more

NASA images by Jeff Schmaltz, LANCE/EOSDIS Rapid Response. Caption by Michael Carlowicz.

NASA image courtesy Jeff Schmaltz, LANCE/EOSDIS MODIS Rapid Response Team at NASA GSFC. Caption by Holli Riebeek.

The winter of 2013–2014 was a study in contrasts between mountains in the far western United States and in the interior West. While people waited in vain for winter snow in California and the Pacific Northwest, snow piled onto the Rocky Mountains in Montana and Wyoming. The contrast is embodied in this image, acquired by the Moderate Resolution Imaging Spectroradiometer (MODIS) on NASA’s Terra satellite on March 12, 2014. Read more

NASA image courtesy Jeff Schmaltz, LANCE/EOSDIS MODIS Rapid Response Team at NASA GSFC. Caption by Holli Riebeek.

      NASA Earth Observatory images by Jesse Allen, using MODIS data from the Land Processes Distributed Active Archive Center (LPDAAC). Caption by Michael Carlowicz.

For many residents of North America, the winter of 2013-14 has felt like one of the coldest in many years. Waves of Arctic air brought extended periods of cold weather and above-average snowfall to the middle and eastern portions of the United States and Canada. Seven Midwestern states had one of their top-ten coldest winters, and the Great Lakes were chilled until they reached nearly 91 percent ice cover. Even portions of Mexico and Central America were cooler than normal. Read More

NASA Earth Observatory images by Jesse Allen, using MODIS data from the Land Processes Distributed Active Archive Center (LPDAAC). Caption by Michael Carlowicz.

NASA Earth Observatory image by Jesse Allen, using data from the Land Atmosphere Near real-time Capability for EOS (LANCE). Caption by Adam Voiland.

Soggy winters are not unusual in the United Kingdom, but this winter has been in a category of its own. UK Met Office meteorologists had just declared January 2014 the wettest month on record for parts of southern Britain when another series of storms swept across the area in early February.

The Moderate Resolution Imaging Spectroradiometer (MODIS) on NASA’s Terra satellite captured this image of an extratropical cyclone bearing down on the United Kingdom on February 12, 2014. Mature extratropical cyclones often feature comma-shaped cloud patterns that are the product of “conveyor belt” circulation. While heavy precipitation is often present near the low-pressure head of the comma, a slot of dry air usually trails the west side of the tail. Read more

NASA Earth Observatory image by Jesse Allen, using data from the Land Atmosphere Near real-time Capability for EOS (LANCE). Caption by Adam Voiland.