Tag: Climate Variability and Change

Climate Variability and Change

NASA Earth Observatory image by Jesse Allen and Robert Simmon, using data from the Land Atmosphere Near real-time Capability for EOS (LANCE). Caption by Adam Voiland.

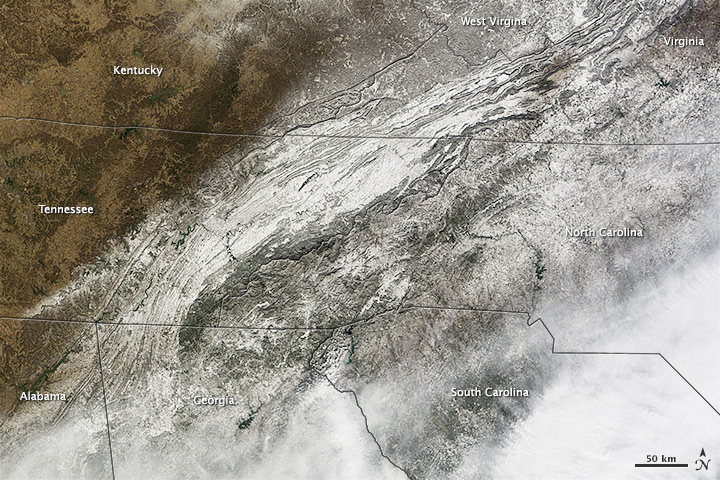
A large winter storm swept through the southeastern United States in January 2014, dropping snow and ice on an area unaccustomed to dealing with winter weather.

While clouds still covered most of the area affected by the storm when the Terra satellite passed over on January 29, 2014, the Moderate Resolution Imaging Spectroradiometer (MODIS) on board captured this view of snow on the ground in parts of northern Georgia, northern South Carolina, eastern Tennessee, and western North Carolina. According to the National Weather Service, the storm dropped up to 9 inches (23 centimeters) of snow in parts of North Carolina, 4 inches (10 centimeters) in parts of South Carolina and Georgia, and 2 inches (5 centimeters) in parts of Tennessee. Atlanta received 2.6 inches (6.6 centimeters) of snow. Many areas also received significant amounts of freezing rain and sleet. Read more

NASA Earth Observatory image by Jesse Allen and Robert Simmon, using data from the Land Atmosphere Near real-time Capability for EOS (LANCE). Caption by Adam Voiland.

NASA images courtesy LANCE/EOSDIS MODIS Rapid Response Team at NASA GSFC. Caption by Holli Riebeek.

2013 was a dry year for California, but it has nothing on 2014 so far. January is on track to be California’s driest on record, and since the state receives half of its precipitation between December and February, it appears that the 2013-2014 water year could be the driest on record too. With that possibility in view, California governor, Edmund G. Brown, Jr. declared a state of emergency on January 17, urging Californians to conserve water.

From brown landscapes to the bare mountains, California is clearly dry in this view from the Moderate Resolution Imaging Spectroradiometer (MODIS) on NASA’s Terra satellite, taken on January 18, 2014. The lower image, taken on January 18, 2013, contrasts last year’s drought conditions with the extreme conditions currently in place. Read more

NASA images courtesy LANCE/EOSDIS MODIS Rapid Response Team at NASA GSFC. Caption by Holli Riebeek.

NASA images courtesy LANCE/EOSDIS MODIS Rapid Response Team at NASA GSFC. Caption by Holli Riebeek.

Individual deciduous trees mark the turning of the seasons with pale buds in the spring, densely packed green leaves in summer, vibrant red, orange, or yellow tones in fall, and bare branches in the cold of winter. Forests also mark the changes, but on a grander scale. In this series of images from the Moderate Resolution Imaging Spectroradiometer (MODIS) on NASA’s Terra satellite, forests mark the time along the southern ridges of the Appalachian Mountains, where the states of North Carolina, Tennessee, Georgia, and South Carolina all come together. Read more

NASA images courtesy LANCE/EOSDIS MODIS Rapid Response Team at NASA GSFC. Caption by Holli Riebeek.

NASA Earth Observatory image by Jesse Allen, using data from the Level 1 and Atmospheres Active Distribution System (LAADS). Caption by Adam Voiland, with information from Paul Newman (NASA Goddard), Marshall Shepherd (University of Georgia), and John Knox (University of Georgia).

The map above shows land surface temperature anomalies in North America for January 1-7, 2014. Based on data from the Moderate Resolution Imaging Spectroradiometer (MODIS) on NASA’s Terra satellite, the map depicts temperatures for that period compared to the 2001-2010 average for the same week. Areas with warmer than average temperatures are shown in red; near-normal temperatures are white; and areas that were cooler than the base period are blue. Gray indicates areas where clouds blocked the satellite from collecting usable data. While much of the United States was experiencing frigidly cold temperature, Sochi Russia was warmer than average.  Read more

NASA Earth Observatory image by Jesse Allen, using data from the Level 1 and Atmospheres Active Distribution System (LAADS). Caption by Adam Voiland, with information from Paul Newman (NASA Goddard), Marshall Shepherd (University of Georgia), and John Knox (University of Georgia).

NASA Earth Observatory image by Jesse Allen, using data from the Level 1 and Atmospheres Active Distribution System (LAADS). Caption by Holli Riebeek.

A deadly heatwave left its signature on the land in Argentina. This map shows land surface temperatures between December 19-26, 2013, compared to average temperatures for the same period from 2000-2012. Nearly the entire country was much warmer than normal, with some locations more than 15°Celsius above average.

Argentina was in the midst of an intense two-week heatwave when the data for the map was acquired by the Moderate Resolution Imaging Spectroradiometer (MODIS) on NASA’s Terra satellite. Read more

NASA Earth Observatory image by Jesse Allen, using data from the Level 1 and Atmospheres Active Distribution System (LAADS). Caption by Holli Riebeek.