

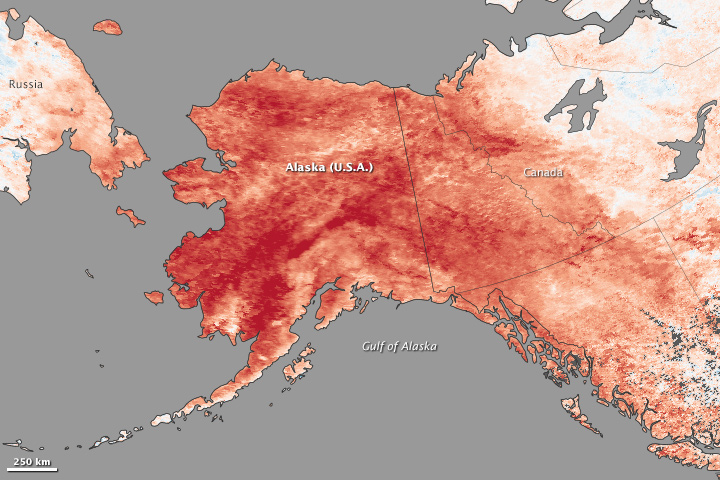
While much of the continental United States endured several cold snaps in January 2014, record-breaking warmth gripped Alaska. Spring-like conditions set rivers rising and avalanches tumbling.
This map depicts land surface temperature anomalies in Alaska for January 23-30, 2014. Based on data from the Moderate Resolution Imaging Spectroradiometer (MODIS) on NASA’s Terra satellite, the map shows how 2014 temperatures compared to the 2001-2010 average for the same week. Areas with warmer than average temperatures are shown in red; near-normal temperatures are white; and areas that were cooler than the base period are blue. Gray indicates oceans or areas where clouds blocked the satellite from collecting usable data. Read more
- NASA Earth Observatory images by Jesse Allen and Jeff Schmatltz, using data from the Land Processes Distributed Active Archive Center (LPDAAC) and the LANCE/EOSDIS Rapid Response. Caption by Adam Voiland.