Year: 2015

cirrus_cat_2015092

NASA Earth Observatory image by Jesse Allen, using data provided by John Yorks and Matthew McGill of the Cloud-Aerosol Transport System (CATS) team. Caption by Kathryn Hansen.

Cirrus—the wispy, icy clouds that form high in the atmosphere—are known to have a net warming effect on the climate. But how much? The question is hard to answer because even among cirrus clouds, there is wide variety and complexity in their structure.

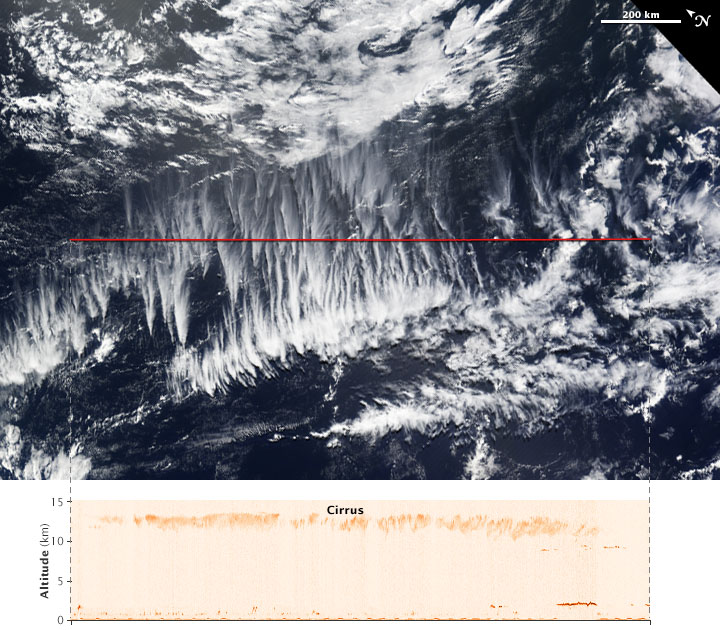
The Moderate Resolution Imaging Spectroradiometer (MODIS) on NASA’s Terra satellite acquired a natural-color view of clouds over the South Pacific on April 2, 2015. Cirrus are the thinner clouds appearing to spread out from points across the center of the image.

The red line on the MODIS image shows the area scanned just hours before by the Cloud-Aerosol Transport System (CATS) onboard the International Space Station. “The space station orbit provides comprehensive coverage of the tropical and mid-latitude regions, where cirrus clouds are most prevalent,” said John Yorks, science lead of the CATS team at NASA’s Goddard Space Flight Center. Read more

For two weeks in late June and early July 2015, western Europe and the Pacific Northwest of North America endured record-setting heat and parched landscapes. Other parts of the world got a taste of the heat, too, as new temperature records were set on three continents.

The map above shows daytime land surface temperature anomalies in Europe from June 30 to July 9, 2015. Temperatures for those ten days are compared to the 2001–2010 average for the same period. Shades of red depict areas where the land surface was hotter than the long-term average; areas in blue were below average. White pixels were normal, and gray pixels did not have enough data, most likely due to excessive cloud cover.

This temperature anomaly map is based on data from the Moderate Resolution Imaging Spectroradiometer (MODIS) on NASA’s Terra satellite. Observed by satellites uniformly around the world, land surface temperatures (LSTs) are not the same as air temperatures. LSTs reflect the heating of the land by sunlight, and they can sometimes be significantly hotter or cooler than air temperatures. Read more

europelsta_tmo_2015190

NASA Earth Observatory images created by Jesse Allen, using Land Surface Data from the MODIS Science Team. Caption by Michael Carlowicz.

britishcolumbia_tmo_2015186

NASA images by Jeff Schmaltz, LANCE/EOSDIS Rapid Response. Caption by Mike Carlowicz.

A difficult fire season in western Canada brought its impacts to coastal city streets in early July 2015. A thick pall of smoke settled over Vancouver and adjacent areas of British Columbia, leading some residents to wear face masks and health officials to warn residents and World Cup tourists against outdoor activities.

The Moderate Resolution Imaging Spectroradiometer (MODIS) on NASA’s Terra satellite acquired these images in the late morning on July 5 and 6. Note how the tan and gray smoke almost completely obscures the Strait of Georgia and southern Vancouver Island. Winds shifted abruptly between July 5 and 6, driving the smoke plume toward the east, dispersing it in some places while fouling the air in areas to the east, such as the Fraser Valley. Read more

northsea_tmo_2015157

NASA Earth Observatory images by Jesse Allen, using data from the Level 1 and Atmospheres Active Distribution System (LAADS). Caption by Rachel Carlowicz with Mike Carlowicz. Interpretation insight provided by Mike Behrenfeld, Oregon State University, and Jochen Wollschläger, Helmholtz-Zentrum Geesthacht.

Despite its cold waters and harsh winds, the North Sea is a fertile basin for phytoplankton blooms. The drifting, plantlike organisms tend to be most abundant in late spring and early summer due to high levels of nutrients in the water and increasing sunlight. The intense winds blowing over the relatively shallow North Sea causes a lot of vertical and horizontal mixing that brings nutrients to the surface, as does runoff from European rivers.

The first image, acquired on June 6, 2015, by the Moderate Resolution Imaging Spectroradiometer (MODIS) on NASA’s Terra satellite, shows a mass of phytoplankton blooming between Denmark, the United Kingdom, and Germany. The milky, light-colored surface waters are likely filled with coccolithophores, whereas the greener areas are probably rich with diatoms or perhaps dinoflagellates. (It is impossible to know for sure without water samples.) Read more

canada_tmo_2015180

NASA image courtesy Jeff Schmaltz, LANCE/EOSDIS MODIS Rapid Response Team at NASA GSFC. Caption and image cropping by Adam Voiland.

The 2015 fire season got off to an unusually early start in Canada when blazes broke out in the Northwest Territories, British Columbia, and Alberta in late May. As the season has progressed, the air in western Canada—as well as large swaths of the United States—grew gray and hazy with smoke.

Beginning on June 28, a sharp trough in the jet stream sent a river of smoke streaming south into the United States. By June 29, smoke darkened the skies over much of Saskatchewan, Alberta, Manitoba, North Dakota, South Dakota, Minnesota, and Iowa.

On June 29, 2015, the Moderate Resolution Imaging Spectroradiometer (MODIS) on NASA’s Terra satellite captured this image of smoke from hundreds of wildfires in western Canada. Read more