 A scientist, Yi-Chun (Jean) Chen, at NASA’s Jet Propulsion Laboratory, and his colleagues were able to show how open-cell versus closed cell clouds affect the brightness, or albedo, of ship tracks.
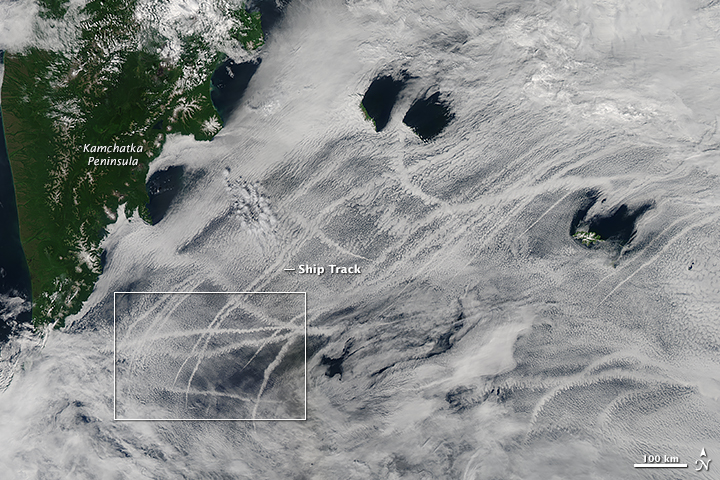
Using data from MODIS on-board both Aqua and Terra and from the Multi-angle Imaging SpectroRadiometer (MISR) on Terra, the team studied the relationship between ship-emitted aerosols and cloud properties. The results suggested that aerosol plumes increased the amount of clouds and albedo in open-cell formation areas; where as, areas with closed-cells were less susceptible to aerosol plumes.
Research available in the April 2015 Journal of Geophysical Research
Read more on NASA’s Earth Observatory