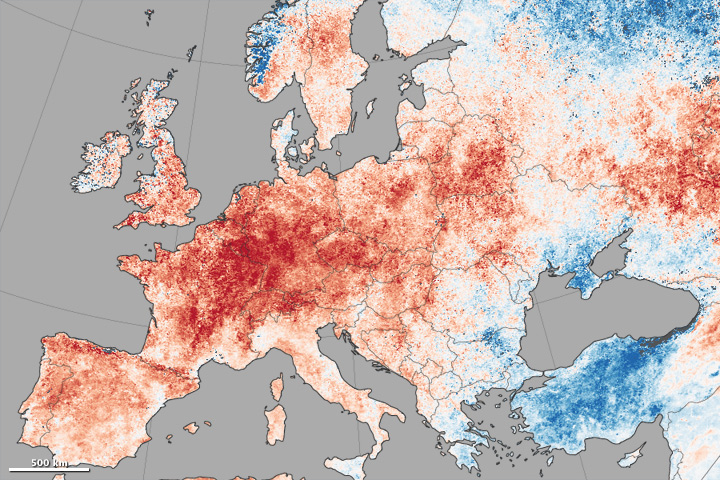
For two weeks in late June and early July 2015, western Europe and the Pacific Northwest of North America endured record-setting heat and parched landscapes. Other parts of the world got a taste of the heat, too, as new temperature records were set on three continents.
The map above shows daytime land surface temperature anomalies in Europe from June 30 to July 9, 2015. Temperatures for those ten days are compared to the 2001–2010 average for the same period. Shades of red depict areas where the land surface was hotter than the long-term average; areas in blue were below average. White pixels were normal, and gray pixels did not have enough data, most likely due to excessive cloud cover.
This temperature anomaly map is based on data from the Moderate Resolution Imaging Spectroradiometer (MODIS) on NASA’s Terra satellite. Observed by satellites uniformly around the world, land surface temperatures (LSTs) are not the same as air temperatures. LSTs reflect the heating of the land by sunlight, and they can sometimes be significantly hotter or cooler than air temperatures. Read more


