Category: News and Events

News and Events

Terra Visits Camp Landsat

Summer is in full swing, but it wouldn’t be complete without a visit to “camp”.. Camp Landsat, that is!

“Terra Visits Camp Landsat” is part story map, part interactive virtual series, highlighting the weekly themes of Camp Landsat 2022. Check out our Week 1: People and Places story map below, focused on Black Rock City — a massive urban area that only exists for one week out of the year, during the annual Burning Man event. View the full screen version by clicking on the icon above (and for a challenge, see if you can find the ceremonial “burning-of-the-man” fire signature in satellite data!)

For full screen access to the story map, click the icon above or use this link!

Dr. Helen Worden

We recently featured several important scientists who use Terra data in their research, including Dr. Rebecca Buchholz (check out the post here) who works with Dr. Helen Worden, the US Principal Investigator for the Measurements of Pollution in the Troposphere (MOPITT) sensor to evaluate spatial patterns of air pollution critical for natural hazard response and public health planning.

MOPITT data are used to derive carbon monoxide concentrations such as those released from burning vegetation, coal, and other combustible plant material. MOPITT carbon monoxide measurements are used to determine where wildfires are burning and to infer the presence of other air pollutants, too. After analyzing over 15 years of data, the MOPITT team found that overall carbon monoxide levels have decreased globally over the past decade, but with varying amounts related to regional land use differences. Additionally, the team also discovered that an increase in new seasonal peaks of air pollution– especially from summer wildfires burning in the American Pacific Northwest – contribute to increased health risks “downwind” of these fires – even impacting places as far away as Colorado!  Find out more about this research in this NCAR/UCAR News article and this Earth Observatory Image of the Day!

For more on Dr. Helen Worden’s research, check out her bio here as well as her 2012 interview by our own Tassia Owens!

It’s been a busy summer for the MODIS instrument! Here are a few highlights you may have missed:

‣ On July 1st, our long-serving MODIS instrument lead, Dr. Michael King, officially retired. While we’re sad to see him go and wish him the best in his new adventures, we’re excited to introduce our new MODIS lead, Dr. Miguel Roman! Look for his updated bio on the Terra website soon.

‣ The NASA Land and Atmosphere data teams held meetings in May and June (you can find presentation materials and more info with this link to the MODIS newsfeed). 

‣ A brand new reprocessed MODIS cloud properties dataset that combines both Terra and Aqua data is now available for download and use. Find out more information in this informative post from the LAADS DAAC

‣ Check out these two recent research features on the Natural Capital Project (links here and here), a collaboration among scientists, farmers, and the luxury clothing industry. Terra MODIS vegetation index data products are being used as part of this effort to model future goat-grazing land use in order to benefit both farmers and the environment. Frequent sampling and wide area coverage of MODIS normalized difference vegetation index (NDVI) dataset were leveraged and used as input for climate models, resulting in more sustainable land-use practices.

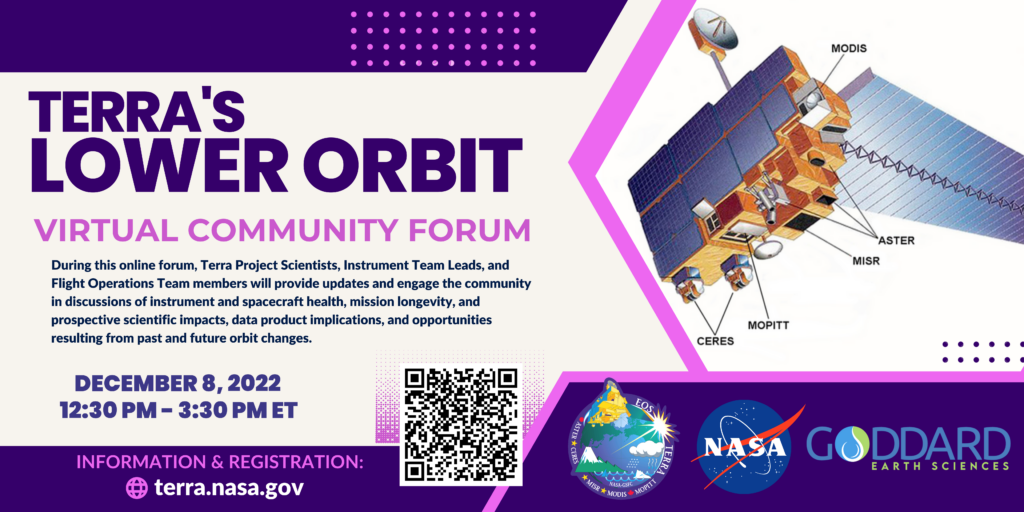
If you’re a frequent user of Terra data, you’re probably somewhat aware of the recent and upcoming changes to Terra’s “traditional” orbit. (If you weren’t aware of these upcoming changes, or if you just want to read an excellent overview of Terra’s legacy and future, click on the link to read Blumenfeld’s article “From Terra to Terra Firma”).

In efforts to get the news out about Terra’s lowering and drift – and to inform users of potential data impacts resulting from these orbit changes — we’ll be posting several new infographics and short animations on the Terra website, as part of a larger campaign to celebrate over two decades of Terra data. Any graphics posted are available for public use and redistribution. (Click on the image for larger resolution and please share with others!)

Here’s an example of the new graphics we’ll be posting on the site:

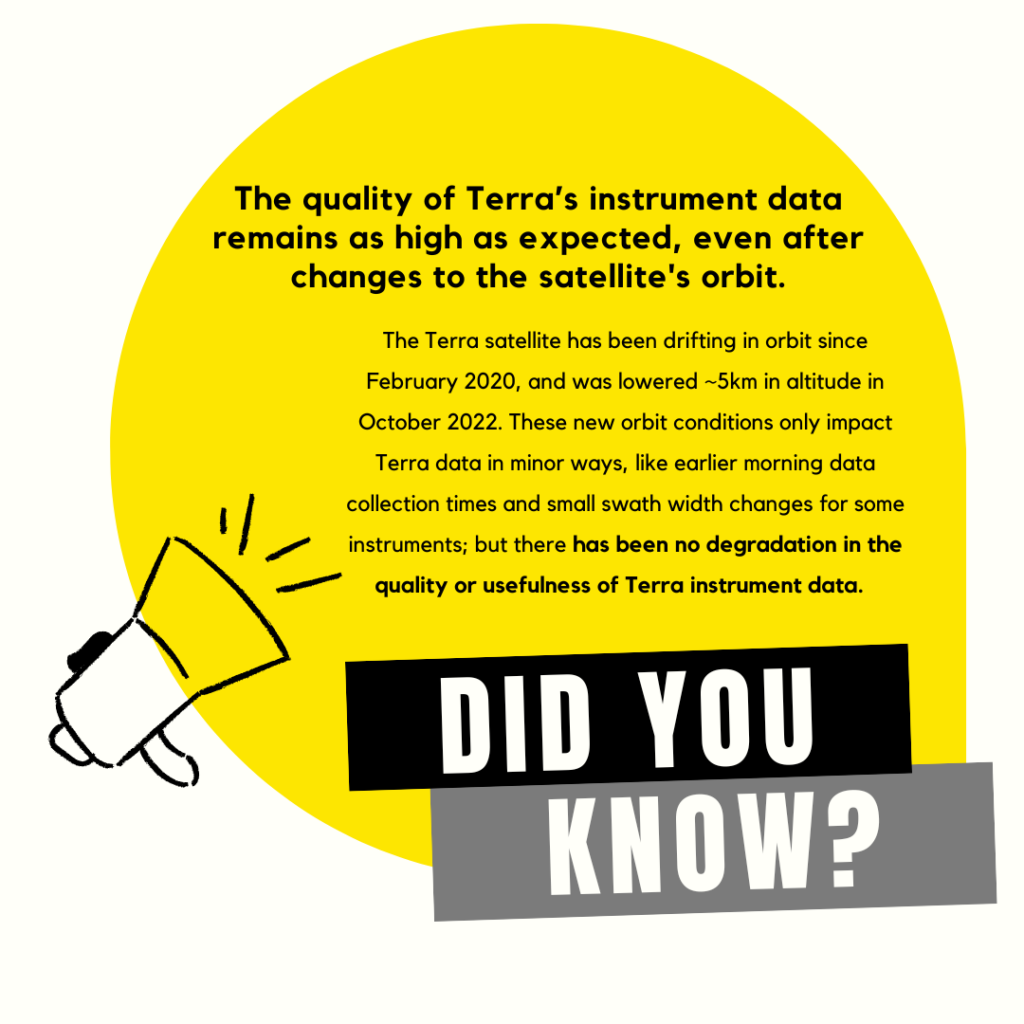
Drifting: For over 20 years, Terra has shared an orbital path above the earth with a group of other polar-orbiting, earth-watching satellites (aka Terra's satellite constellation). Terra also passes over the equator at the same time every day. But how does Terra maintain its altitude and speed when Earth's gravity is constantly pulling on it? The answer: by burning fuel to counteract the drag! But Terra's also getting older (in satellite years) and is almost out of fuel; so since 2020, the satellite has been drifting, with no burns to counter the drag, causing slight increases in orbit speed and a resulting earlier passover time each day. DATA IMPACTS: Minor. Data is collected <15 minutes earlier each morning. Slight changes to surface shadows and data swath edges.

Constellation Exit: In October 2022, Terra will be lowered about 4 miles out of its constellation group's path (to make room for new missions) BUT will continue drifting and collecting data in an orbit that's closer to Earth. DATA IMPACTS: Slight to minor. Terra will be even closer to earth, so the images will be collected even earlier in the morning (>15 min) and will have more detail, with only slight changes to swath margins.

Passivation: Terra will keep collecting data until HQ begins the passivation process (aka turning off the satellite's power), sometime within the next 3 to 5 years.
Timeline showing important dates and upcoming orbit changes for the Terra satellite.

This infographic gives a simplified overview of Terra’s orbital movements, from its current drift, through the constellation exit this Fall, and finally into a lower, drifting orbit – along with the estimated (minor) effects possible due to these orbital changes. 

Check the Terra website often for additional information on the Celebrating 25 Years of Terra Data campaign and events!

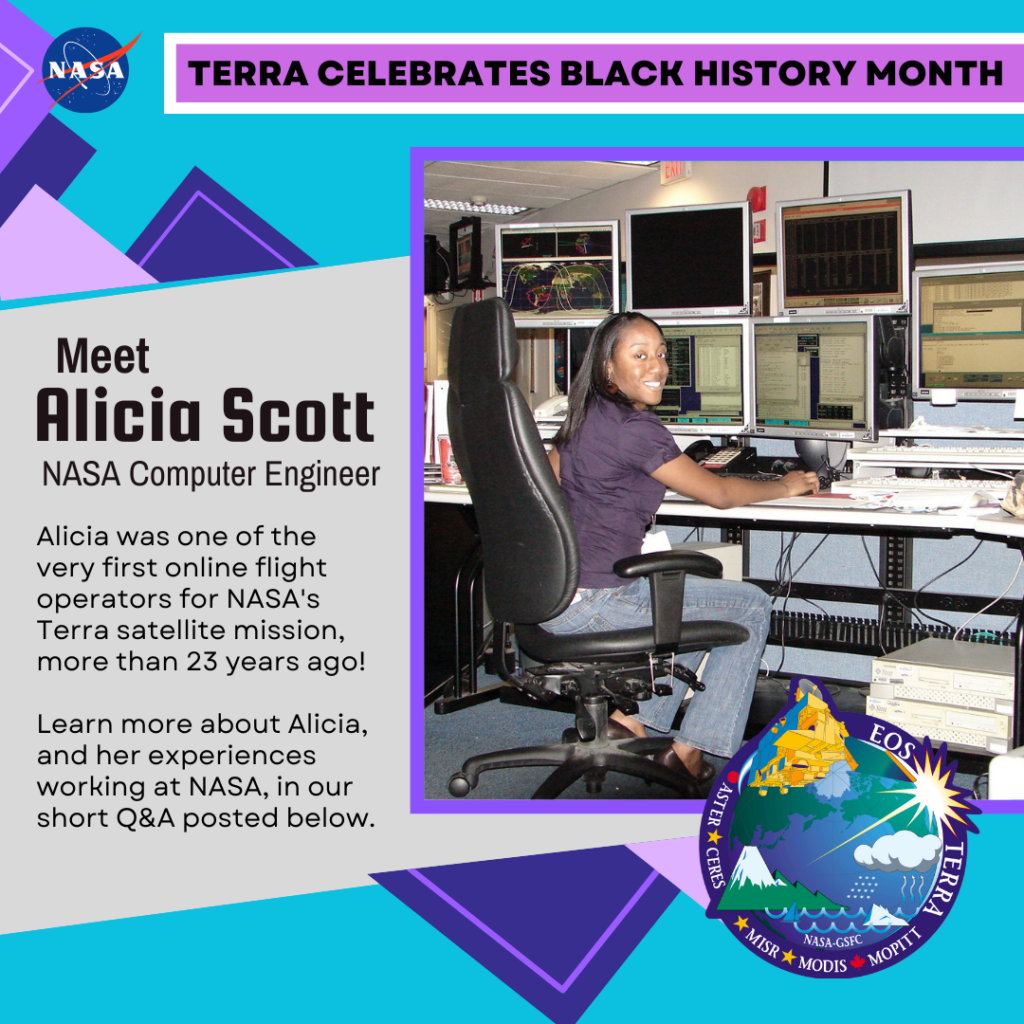
Pictures of the three scientists featured in the post.

With Terra’s 25th Anniversary only two years away (December 2024), we’re kicking off the celebration early in our News and Events section with a new series highlighting some of Terra’s researchers, data users, educators, and science communicators. We’re especially excited to promote current and proposed research that uses Terra data in unique or novel ways!  (Do you know someone who’s made important contributions to the Terra mission? Or a groundbreaking Terra study that you feel made a substantial impact in the fields of earth science or remote sensing? We’d love to feature them – email us your ideas!)

Our first post in this series highlights three trailblazing women at NASA who have contributed to Terra’s scientific legacy, while showcasing the collaborative efforts among scientists at Goddard, JPL, and NCAR/UCAR. Check out their stories below!


Dr. Nai-Yung Christina Hsu (GSFC)

Dr. Christina Hsu, a researcher from GSFC, has incorporated data from many of Terra’s instruments into her research. Most notably, in 2004, she developed a Deep Blue algorithm for MODIS data that better characterizes aerosol properties over deserts and urban areas. (Read the groundbreaking article here!)

More recently, Dr. Hsu collaborated with a team studying regional differences in air pollution reductions, due to the global COVID-19 lockdowns of 2020. She used datasets from MODIS and MISR (two instruments on Terra) to analyze aerosol optical depth (click the link to learn more!).  Learn more about Dr. Hsu’s research using this link, and access the full article here!


Abigail (Abbey) Nastan (JPL)

Check out this recent Earthdata feature of our own MISR instrument Applications and Communications lead, Abbey Nastan! This summary gives an overview of the diverse portfolio of projects that Abbey is currently working on, including MERLIN – a unique visualization tool that leverages the MISR Plume Height Project dataset, giving new life to “old-er” data.

For more information on the MERLIN tool and how it was made, download this PDF.


Dr. Rebecca Buchholz (NCAR/UCAR)

Meet Dr. Rebecca Buchholz, a MOPITT Project Scientist who has worked at NCAR/UCAR since 2014 and has used MOPITT’s carbon monoxide dataset to study long-term patterns of air pollution transportation, especially that associated with wildfires. In a Scientific American news article last month, Dr. Buchholz summarized her recent research findings (published in Nature Communications) that show a significant increase in Western U.S. wildfire air pollution during the month of August, a new peak that largely negates California’s efforts to reduce annual air pollution. (She also gave Terra’s long data-record a shout-out!)  Read more about her research here!