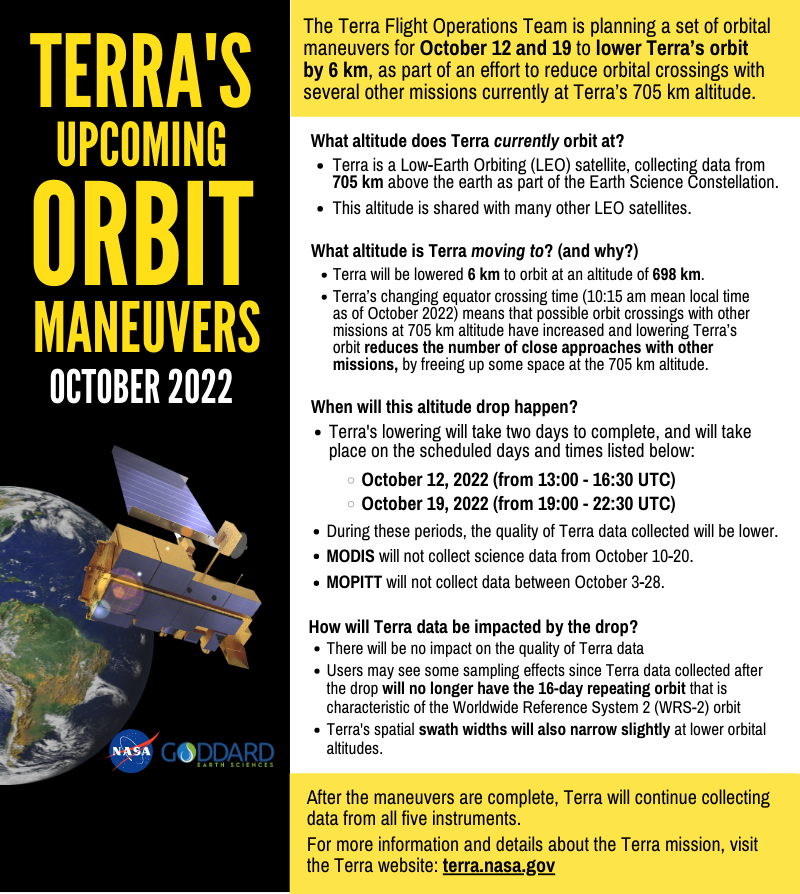
The Terra Flight Operations Team is planning a set of orbital maneuvers for October 12 and 19 to lower Terra’s orbit by 6 km, as part of an effort to reduce orbital crossings with several other missions currently at Terra’s 705 km altitude. For more information, view the animation and graphic below, which are also available on the Terra website.
Brief animation of Terra’s October Orbital Maneuvers
NASA previously released a Request for Information (RFI)on a Terra, Aqua, and Aura Drifting Orbits Workshop, for which the response date is October 11, 2022.
Summer is in full swing, but it wouldn’t be complete without a visit to “camp”.. Camp Landsat, that is!
“Terra Visits Camp Landsat” is part story map, part interactive virtual series, highlighting the weekly themes of Camp Landsat 2022. Check out our Week 1: People and Placesstory map below, focused on Black Rock City — a massive urban area that only exists for one week out of the year, during the annual Burning Man event. View the full screen version by clicking on the icon above (and for a challenge, see if you can find the ceremonial “burning-of-the-man” fire signature in satellite data!)
For full screen access to the story map, click the icon above or use this link!
We recently featured several important scientists who use Terra data in their research, including Dr. Rebecca Buchholz (check out the post here) who works with Dr. Helen Worden, the US Principal Investigator for the Measurements of Pollution in the Troposphere (MOPITT) sensor to evaluate spatial patterns of air pollution critical for natural hazard response and public health planning.
MOPITT data are used to derive carbon monoxide concentrations such as those released from burning vegetation, coal, and other combustible plant material. MOPITT carbon monoxide measurements are used to determine where wildfires are burning and to infer the presence of other air pollutants, too. After analyzing over 15 years of data, the MOPITT team found that overall carbon monoxide levels have decreased globally over the past decade, but with varying amounts related to regional land use differences. Additionally, the team also discovered that an increase in new seasonal peaks of air pollution– especially from summer wildfires burning in the American Pacific Northwest – contribute to increased health risks “downwind” of these fires – even impacting places as far away as Colorado! Find out more about this research in this NCAR/UCAR News article and this Earth Observatory Image of the Day!
It’s been a busy summer for the MODIS instrument! Here are a few highlights you may have missed:
‣ On July 1st, our long-serving MODIS instrument lead, Dr. Michael King, officially retired. While we’re sad to see him go and wish him the best in his new adventures, we’re excited to introduce our new MODIS lead, Dr. Miguel Roman! Look for his updated bio on the Terra website soon.
‣ A brand new reprocessed MODIS cloud properties dataset that combines both Terra and Aqua data is now available for download and use. Find out more information in this informative post from the LAADS DAAC.
‣ Check out these two recent research features on the Natural Capital Project (links here and here), a collaboration among scientists, farmers, and the luxury clothing industry. Terra MODIS vegetation index data products are being used as part of this effort to model future goat-grazing land use in order to benefit both farmers and the environment. Frequent sampling and wide area coverage of MODIS normalized difference vegetation index (NDVI) dataset were leveraged and used as input for climate models, resulting in more sustainable land-use practices.