Tag: MODIS

MODIS News and Events

britishcolumbia_tmo_2015186

NASA images by Jeff Schmaltz, LANCE/EOSDIS Rapid Response. Caption by Mike Carlowicz.

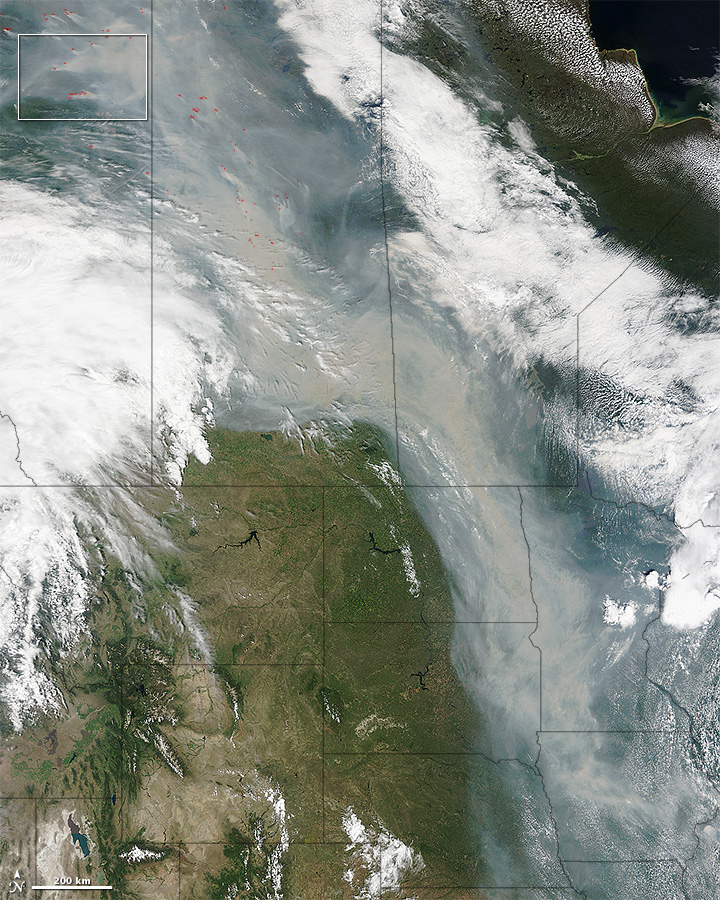
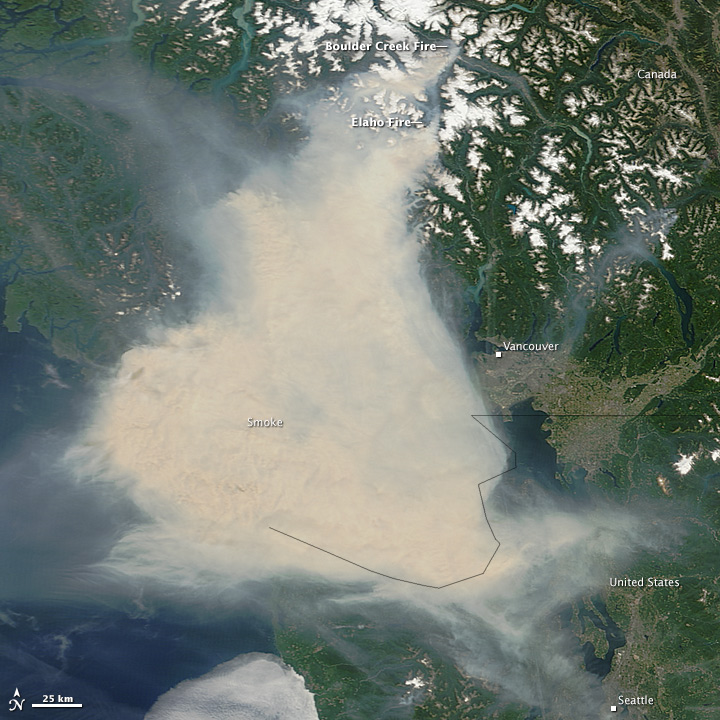
A difficult fire season in western Canada brought its impacts to coastal city streets in early July 2015. A thick pall of smoke settled over Vancouver and adjacent areas of British Columbia, leading some residents to wear face masks and health officials to warn residents and World Cup tourists against outdoor activities.

The Moderate Resolution Imaging Spectroradiometer (MODIS) on NASA’s Terra satellite acquired these images in the late morning on July 5 and 6. Note how the tan and gray smoke almost completely obscures the Strait of Georgia and southern Vancouver Island. Winds shifted abruptly between July 5 and 6, driving the smoke plume toward the east, dispersing it in some places while fouling the air in areas to the east, such as the Fraser Valley. Read more

northsea_tmo_2015157

NASA Earth Observatory images by Jesse Allen, using data from the Level 1 and Atmospheres Active Distribution System (LAADS). Caption by Rachel Carlowicz with Mike Carlowicz. Interpretation insight provided by Mike Behrenfeld, Oregon State University, and Jochen Wollschläger, Helmholtz-Zentrum Geesthacht.

Despite its cold waters and harsh winds, the North Sea is a fertile basin for phytoplankton blooms. The drifting, plantlike organisms tend to be most abundant in late spring and early summer due to high levels of nutrients in the water and increasing sunlight. The intense winds blowing over the relatively shallow North Sea causes a lot of vertical and horizontal mixing that brings nutrients to the surface, as does runoff from European rivers.

The first image, acquired on June 6, 2015, by the Moderate Resolution Imaging Spectroradiometer (MODIS) on NASA’s Terra satellite, shows a mass of phytoplankton blooming between Denmark, the United Kingdom, and Germany. The milky, light-colored surface waters are likely filled with coccolithophores, whereas the greener areas are probably rich with diatoms or perhaps dinoflagellates. (It is impossible to know for sure without water samples.) Read more

canada_tmo_2015180

NASA image courtesy Jeff Schmaltz, LANCE/EOSDIS MODIS Rapid Response Team at NASA GSFC. Caption and image cropping by Adam Voiland.

The 2015 fire season got off to an unusually early start in Canada when blazes broke out in the Northwest Territories, British Columbia, and Alberta in late May. As the season has progressed, the air in western Canada—as well as large swaths of the United States—grew gray and hazy with smoke.

Beginning on June 28, a sharp trough in the jet stream sent a river of smoke streaming south into the United States. By June 29, smoke darkened the skies over much of Saskatchewan, Alberta, Manitoba, North Dakota, South Dakota, Minnesota, and Iowa.

On June 29, 2015, the Moderate Resolution Imaging Spectroradiometer (MODIS) on NASA’s Terra satellite captured this image of smoke from hundreds of wildfires in western Canada. Read more

NASA image by Jeff Schmaltz, LANCE/EOSDIS Rapid Response. Caption by Kathryn Hansen.

NASA image by Jeff Schmaltz, LANCE/EOSDIS Rapid Response. Caption by Kathryn Hansen.

Spring and summer are the prime seasons for dust storms in China’s Taklimakan Desert. On April 1, 2015, the Moderate Resolution Imaging Spectroradiometer (MODIS) on NASA’s Terra satellite captured this natural-color image of dust from the desert and from the greater Tarim Basin.

The Tarim is bordered by the Tian Shan mountains to the north (obscured by clouds in this image) and the Kunlun Shan mountains to the south. The basin opens up on its east side, but that’s not necessarily an escape route for dust. The prevailing low-altitude winds come from the east, keeping most dust below 5 kilometers—about the height of the mountain ranges—and confined to the desert. Read more

The Advanced Spaceborne Thermal Emission and Reflection Radiometer (ASTER) is a 15-channel imaging instrument operating on NASA’s Terra satellite. A joint project between the U.S. National Aeronautics and Space Administration and Japan’s Ministry of Economy, Trade, and Industry, ASTER has been acquiring data for 15 years, since March 2000. The archive now contains over 2.8 million scenes; for the majority of them, a stereo pair was collected using nadir and backward telescopes imaging in the NIR wavelength.The majority of users require only a few to a few dozen scenes for their work. Studies have ranged over numerous scientific disciplines, and many practical applications have benefited from ASTER’s unique data. A few researchers have been able to mine the entire ASTER archive, that is now global in extent due to the long duration of the mission. Six examples of global products are described in this contribution:the ASTER Global Digital Elevation Model (GDEM), the most complete, highest resolution DEM available to all users; the ASTER Emissivity Database (ASTER GED), a global 5-band emissivity map of the land surface; the ASTER Global Urban Area Map (AGURAM), a 15-m resolution database of over 3500 cities;the ASTER Volcano Archive (AVA), an archive of over 1500 active volcanoes; ASTER Geoscience products of the continent of Australia; and the Global Ice Monitoring from Space (GLIMS) project.

Access the complete article on International Journal of Applied Earth Observation and Geoinformation