The Principal Investigator for the Measurements Of Pollution In the Troposphere (MOPITT) instrument on-board Terra, James R. Drummond, was awarded the Canadian Aeronautics and Space Insitut Alouette Award. The Alouette Award is awarded in recognition of outstanding contributions to the advancement of Canadian space technology, application, science, or engineering. Read the entire press release from CASI.
CASI Aloutte Award Press Release
Jim Drummond has been the Principal Investigator for a spectacularly successful Canadian satellite instrument for three decades, and also has made many invaluable contributions to Canada’s space program over the course of his long and distinguished career. These contributions, combined with his impassioned and tireless leadership in the satellite community, both nationally and internationally, have provided a body of research and accomplishments that make him an outstanding recipient of this prestigious award.
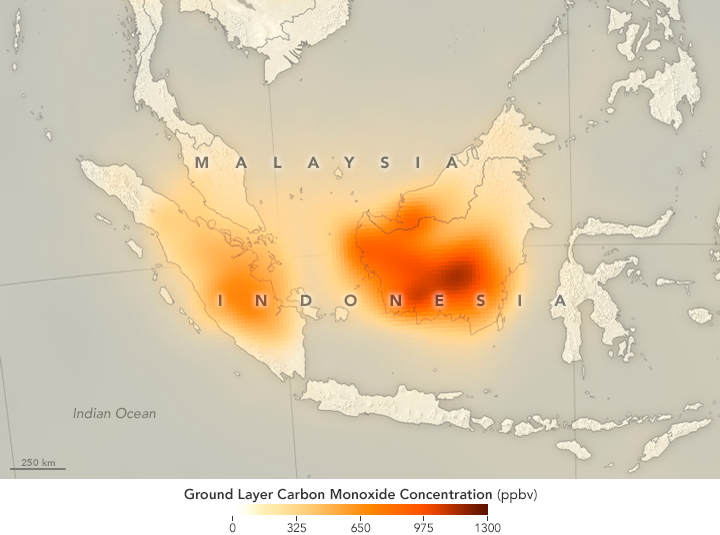
Jim is best-known in the space community for his leadership of the Canadian-led space instrument MOPITT (Measurement Of Pollution In The Troposphere) from conception to launch to celebrating its 20th anniversary on orbit. MOPITT was launched on NASA’s Terra satellite on December 18, 1999 and since then has made more than 1.3 billion measurements, resulting in over 470 publications. MOPITT measures carbon monoxide, and is notable for producing the first continuous global tropospheric chemical measurements from satellite and for mapping the global transport of pollution. MOPITT is a Canadian instrument; conceived, designed and constructed in Canada.
Jim began his scientific career at the University of Oxford where he completed his D.Phil. and a Post-Doctoral Fellowship, joining the Physics Department at the University of Toronto in 1979. Jim was the first person to thoroughly develop the concept of the length-modulated radiometer, recognizing the advantages that it offered over pressure-modulated radiometers. Jim and his students developed both balloon-borne and ground-based instruments based on these principles. In the late 1980s, he conceived the original concept for a nadir-viewing satellite instrument capable of measuring tropospheric constituents, including the acquisition of some vertical information using a combination of pressure-modulated cells to probe the upper troposphere and length-modulated cells for the lower troposphere.
Jim’s dedication culminated in the successful launch of the MOPITT instrument in 1999. Twenty years post-launch, Jim continues to be the Principal Investigator for MOPITT, leading an international team of Co-Investigators, including colleagues from the National Center for Atmospheric Research in Colorado, which is responsible for the retrievals.
MOPITT is the first satellite instrument to make long-term global measurements of tropospheric pollutants, focusing on carbon monoxide. It is an eight-channel scanning radiometer that measures upwelling thermal emission and reflected solar radiation from the Earth’s surface and atmosphere. As PI, Jim maintained an active participation in every aspect of the MOPITT instrument design, testing, and characterization, taking a hands-on approach. As one colleague remarked at an international meeting some years ago, after hearing Jim give a talk on the MOPITT instrument, “it’s impressive how well he knows every detail of that instrument inside-out”.
Jim and the Terra satellite team received the 2019 William T. Pecora Team Award from NASA and the U.S. Department of the Interior. The citation notes that “Terra is arguably one of the most successful Earth-sensing satellites ever deployed.” The citation also says that MOPITT was the first instrument “designed to observe the distribution and transport of tropospheric carbon monoxide and, along with other sensors, has helped advance our understanding of air quality and biomass burning emissions.”
Jim is a highly active contributor in the national and international scientific community including service on multiple high-level committees. Of particular relevance to space, he is currently a member of the federal government’s Space Advisory Board and a Member of CSA’s Atmospheric Science Advisory Committee. He was the founding President of the Canadian Network of Northern Research Operators (CNNRO), which was established to advance the collective interests of Canada’s northern research infrastructure operators. From 2014 to 2018, he was the Chair of the Forum of Arctic Research Operators (FARO), which has 20 member nations and aims to facilitate and optimise logistics and operational support for scientific research in the Arctic. Other international roles include Member of the Steering Committee for Network for the Detection of Atmospheric Composition Change, Member and Secretary of the International Commission on Atmospheric Chemistry and Global Pollution, and Canadian Representative to the International Association for Meteorology and Atmospheric Science.
MOPITT measurements continue to be widely used around the world, meeting a great desire for global tropospheric measurements. MOPITT produced the first long-term global maps of carbon monoxide, including movies that clearly show the transport of the products of pollution and biomass burning plumes around the world. Without Jim’s dedication, commitment, and outstanding grasp of experimental issues, MOPITT would not be the success that it is.
“Canadian Aeronautics and Space Institute Announces 2020 Senior Award Honourees.” Press Release, December 16, 2020.
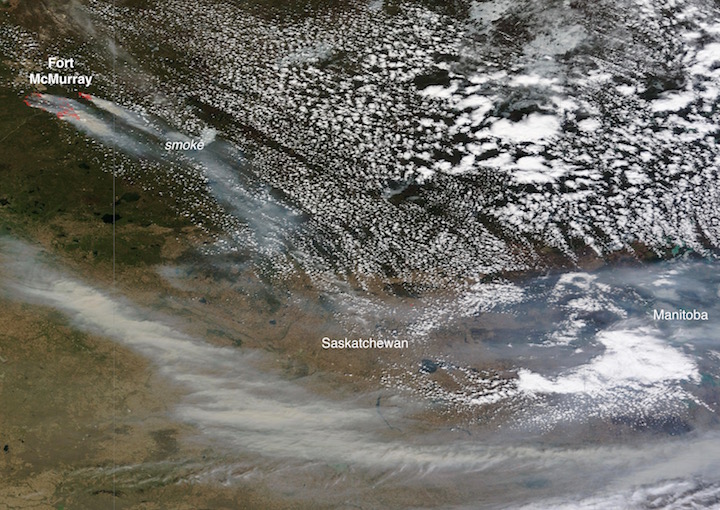
![fort_mcmurray_NRT+AOD_col_d[7]](https://terra.nasa.gov/wp-content/uploads/2016/06/fort_mcmurray_NRTAOD_col_d7.jpeg)