Tag: MODIS

MODIS News and Events

The upcoming combined MODIS/VIIRS Science Team Meeting will be held October 15-19, 2018 at the Sheraton Silver Spring Hotel, 8777 Georgia Avenue, Silver Spring, MD  20910.  Accomplishments and plans for the future of MODIS and VIIRS will be discussed and shared. More information can be found on the MODIS Science Team Meeting website: https://modis.gsfc.nasa.gov/sci_team/meetings/201810/

The registration URL is available on-line at url: https://www.regonline.com/MODIS2018.  Everyone is urged to complete registration by October 10th so that proper planning for attendance and logistics can be achieved. Indicate by clicking on the appropriate box(es) which portions of the meeting you are planning on attending.  Agendas can also be accessed from the website once available.

caspiansea_amo_2016158

Does Dust Affect Water Levels of the Caspian Sea

June 10, 2016

Dust storms over the Caspian Sea lead to increased evaporation and a drop in lake level according to new research using observations of dust collected by instruments on several satellites including the Moderate Imaging Spectroradiometer (MODIS ) and the Multi-angle Imaging Spectroradiometer (MISR) on Terra.


ruapehu_ast_2016111

A Satellite Eye on Mount Ruapehu

June 5, 2010

Mount Ruapehu is one of New Zealand’s most active volcanoes and most visited, dotted with skiers and snowboarders along its slopes.  When it erupts lahars, flows of volcanic debris and sediment, can have devastating impacts, prompting geologists to regularly monitor the volcano, using the Advanced Spaceborne Thermal Emission and Reflection Radiometer on NASA’s Terra satellite.


roanu_tmo_2016142

The Rains of Roanu

May 24, 2016 

Tropical Storm Roanu made landfall in Bangladesh, unleashing heavy winds and rain on the country’s populous coastal communities. On May 21, 2016, the Moderate Resolution Imaging Spectroradiometer (MODIS) on NASA’s Terra satellite acquired this natural-color image of the storm. Roanu progressed northeast over the Bay of Bengal before making landfall in Bangladesh.


beaufort_tmo_2014092-2016117

Early Breakup of the Beaufort Sea Ice 

May 20, 2016 

The Beaufort Sea ice pack starts to thin and break up in spring when temperatures begin to rise, usually in late May. However, much of the Beaufort Sea’s ice had already broken by mid-April. Images from the Moderate Imaging Spectroradiometer (MODIS) on NASA’s Terra satellite captured the progression in April in 2014, 2015, and 2016.


greenlandlsta_tmo_201604

Widespread Warmth Envelops Greenland 

May 18, 2016

Land surface temperature data from the Moderate Imaging Spectroradiometer on NASA’s Terra satellite shows a much warmer than average April in Greenland.


canadalsta_tmo_2016126

Heat Fuels Fire at Fort McMurray

May 7, 2016 

Land surface data from the Moderate Resolution Imaging Spectroradiometer showed increased land surface temperatures near Fort McMurray in Northern Alberta, Canada, where a destructive wildfire burned.


thailandlsta_tmo_201604

Heat Wave Hits Thailand, India

May 4, 2016

Land surface temperature map based on data from the Moderate Imaging Spectroradiometer on NASA’s Terra satellite shows a warmer than average Southeast Asia in April.

April 26, 2016

A Sudden Color Change on Lake KivuThe Moderate Imaging Spectroradiometer (MODIS) on NASA’s Terra Satellite captured images of a whiting event in Lake Kivu. The seasonal event is stronger this year, giving Lake Kivu a milky color. 


April 22, 2016

Using Clouds to Map Life – A team of researchers are using cloud data from the Moderate Imaging Spectroradiometer (MODIS) on NASA’s Terra Satellite to create detailed maps of cloud cover and variability. The team found that cloud cover could be an indicator and a better predictor of a songbird and flower’s range than temperature and precipitation.


April 17, 2016

Yellowstone National Park – Learn about Yellowstone National Park and view an image made possible by the Digital Elevation Model from the Advanced Spaceborne Thermal Emission and Reflection Radiometer (ASTER) on NASA’s Terra satellite.


April 14, 2016

Sierra Nevada Snowpack is Better, But not Normal – Snowpack in the Sierra Nevada mountains dwindled over recent years; however, the winter of 2015-2016 and the strong El Nino provided a thicker and more extensive snowpack. Regardless, snow levels in the Sierra Nevada mountains were still below average. Images from NASA’s Moderate Imaging Spectroradiometer (MODIS) clearly show the difference between years.


April 13, 2016

Antarctic Ice Shelf Sheds Bergs – The Moderate Imaging Spectroradiometer on NASA’s Terra Satellite captured this striking image of the formation of two new icebergs as they broke away from the Nansen Ice Shelf into the Southern Ocean on April 7, 2016.


April 9, 2016

Greening Ascension Island – When Charles Darwin first visited Ascension Island it was barren, but with the assistance of Joseph Hooker in the 1800s plants were introduced and now cover much of this once bleak island. The image from the Advanced Spaceborne Thermal Emissions and Reflection Radiometer (ASTER) on NASA’s Terra satellite shows the now green Ascension Island and it’s Green Mountain.


April 3, 2016

Pavlov Erupts Again – Pavlov Volcano, Alaska’s most active volcano, began erupting for the first time since November 2014. The Moderate Resolution Imaging Spectroradiometer (MODIS) instruments on NASA’s Terra and Aqua satellites acquired images of the ash plume at 11:45 a.m on March 28, 2016.

greatbasin_gis_2004-2011

greatbasin_ndvi_2004-2011

NASA Earth Observatory images by Joshua Stevens, using NDVI data from Aqua/MODIS and mule deer habitat data courtesy of Stoner et al. (2016). Caption by Tassia Owen with Mike Carlowicz.

Raising a new fawn is no easy task. A mother mule deer needs a lot of food for herself and her growing fawn. New satellite-based research suggests that those mule deer mothers are in tune with their environment, with reproduction patterns closely matching the cycles of plant growth in their habitat.

Mule deer need a rich supply of vegetation for the late stages of pregnancy and for nursing their offspring after birth. For this reason, birth rates peak when food sources are increasing, shortly before the peak of annual plant growth. What is surprising is that mule deer in the colder, snowy northern parts of their range give birth earlier in the year than deer in the warmer southern reaches. Through a combination of satellite measurements and ground-based population counts, scientists can see the reason for the difference from space.

Mule deer, a commonly hunted species, are closely monitored and counted by biologists and land managers. A great deal of data about the size and health of the population is collected each year in order to determine the proper number of hunting permits to issue. At the same time, remote sensing scientists have a space-based way to track the health of vegetation. It is called the Normalized Difference Vegetation Index (NDVI), which is a measure of the “greenness” of the landscape. NDVI measures how plants absorb and reflect light; the more infrared light is reflected, the healthier the vegetation. So by measuring the greenness of the mule deer habitat, scientists were able to mark the beginning and peak of the plant and deer growing season.

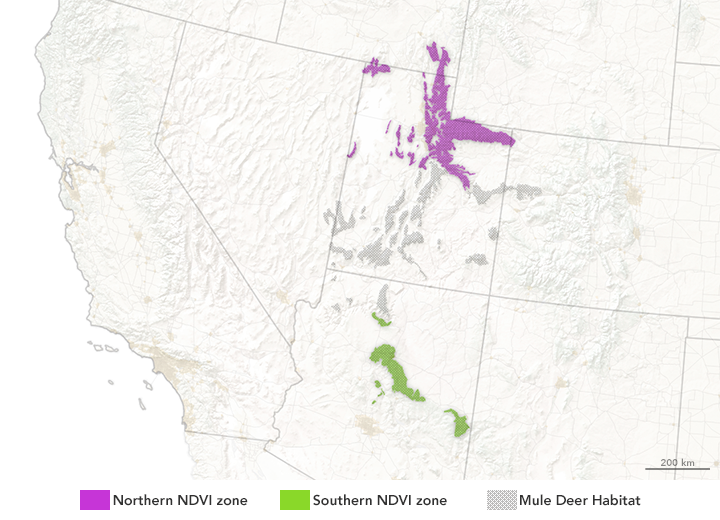
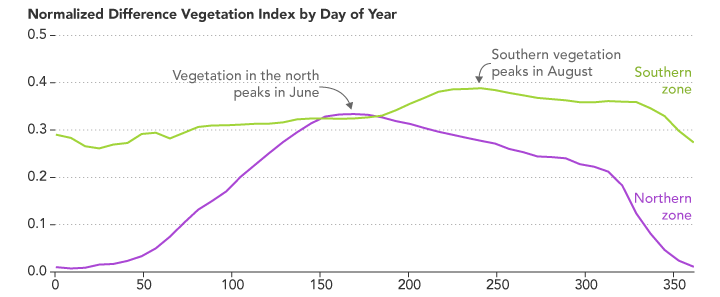
The map above shows the range of mule deer from southern Idaho to central Arizona. The habitat is divided into a green southern zone, a purple northern zone, and a gray transition zone. The mean NDVI for the northern and southern regions is displayed in the graph, which plots the vegetation index for each day of the calendar year. NDVI was measured by the Moderate Resolution Imaging Spectroradiometer (MODIS) instruments on NASA’s Terra and Aqua satellites.

According to lead author David Stoner of Utah State University, vegetation greenness in the northern latitudes peaks earlier than in the southern latitudes. Since nutrient-dense food sources were available earlier in the year, there was more food available for mule deer mothers and babies at the time when they needed it most. That greenness is partly a result of a consistent steady stream of snowmelt moisture feeding the deeply rooted mountain vegetation.

“We had never tracked the deer population this way, and we had never been able to predict it with such precision,” said Stoner. “We can estimate the start and peak of the season using satellite imagery, and then we can map and predict when the deer are giving birth.”

In southern latitudes, on the other hand, the plants are more dependent on rain from summer monsoonal showers. This means vegetation quality peaks later in the year, after a brief drought that comes before the summer monsoons. As a result, does give birth later in the south than in the north.

“This kind of applied research is very important for making remote sensing data relevant to wildlife management efforts,” said Jyoteshwar Nagol, a researcher at the University of Maryland. Deer have a huge economic impact in the United States, from hunting to crop damage to car accidents. As regional climates shift or droughts occur, deer could migrate farther or expand their range to find food.

Reference
Stoner, D., Sexton, S. and Nagol, J. (2016) Ungulate Reproductive Parameters Track Satellite Observations of Plant Phenology across Latitude and Climatological Regimes. PLoS One, 11 (2) e0148780.