

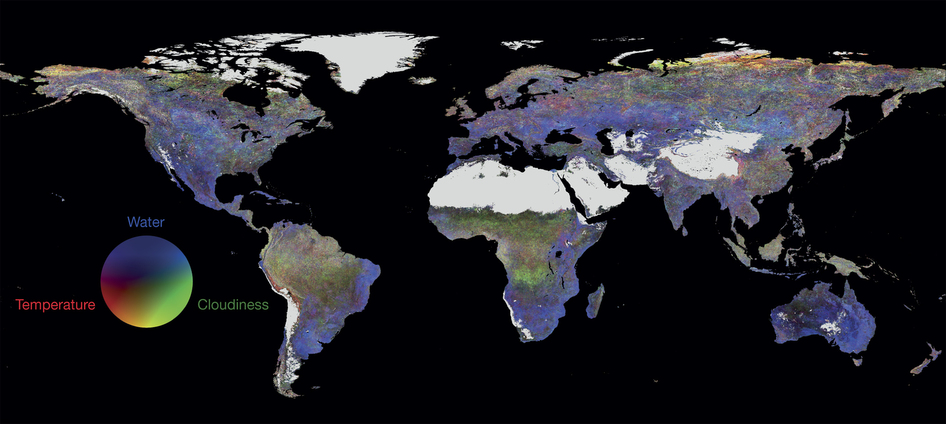
Global contribution of three climate variables to the vegetation sensitivity index from 2000–2013. Temperature is in red, water availability in blue and cloudiness in green. Areas with dominant barren land and permanent ice are grey. Image credit: Sensitivity of global terrestrial ecosystems to climate variability. Alistair W. R. Seddon, Marc Macias-Fauria, Peter R. Long, David Benz & Kathy J. Willis. Nature. (2016) doi:10.1038/nature16986
MODIS data from the past 14 years is being used to generate a model that assesses how different ecosystems respond to climate variability, making it possible to compare regional sensitivity and resilience. The new index is called the vegetation sensitivity index, which makes it possible to compare vulnerability of different regions, looking at why some areas are more vulnerable than others.
The new index is unique. Most studies about ecosystem resilience typically monitor productivity or biodiversity trends over an average climate, such as the normalized difference vegetation index (NDVI) or the enhanced vegetation index (EVI), which also uses MODIS data. This new index instead looks at response to climate variation.
Read the news article from Nature.
Read the journal article from Nature.