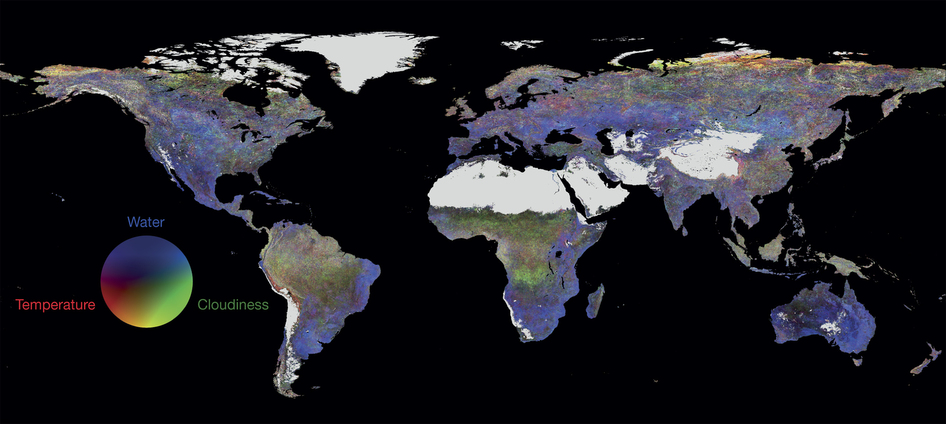
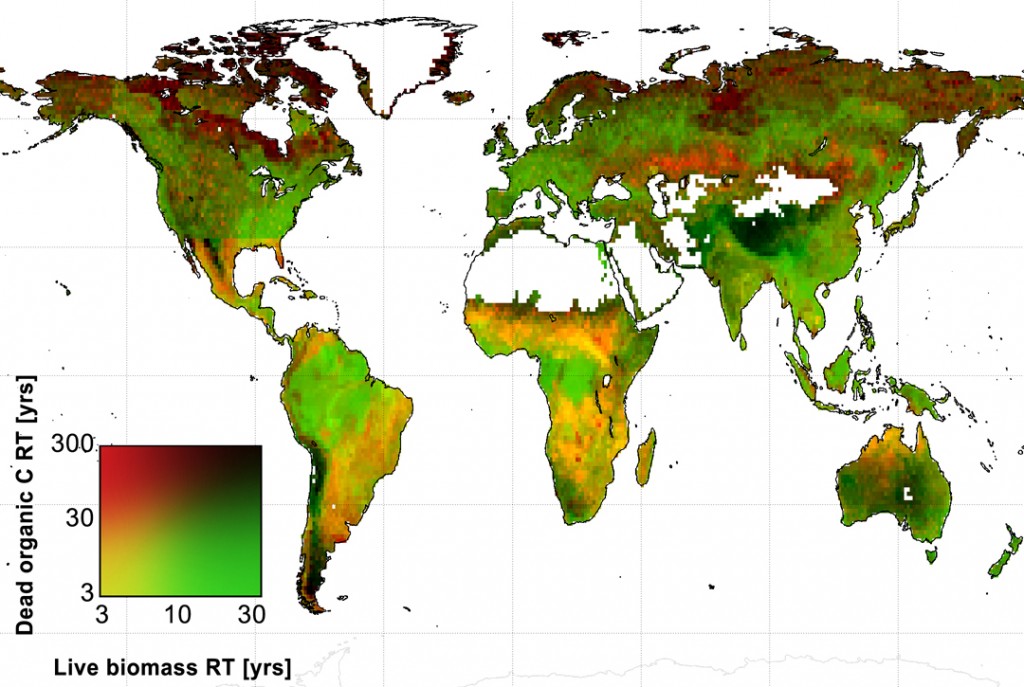
Tag: MODIS

MODIS News and Events

February 19, 2016
Ash Plume and Sea Ice Near Zhupanovsky – Since October, 2015 Zhupanovsky volcano in far eastern Russia has periodically been spewing ash into the atmosphere.  This MODIS image from February 13, 2016 shows an ash plume from Zhupanovsky volcano, which resulted in a code-red for air travel in the region.

Sea surface temperatures indicated that the warm "blob" has dissipated. NASA Earth Observatory image by Jesse Allen, using microwave and infrared multi-sensor SST data from Remote Sensing Systems.

February 12, 2016
The Demise of the Warm Blob – Ocean surface temperatures, showed a warm “blob” off the northern United State’s coast. This cell of warm ocean water in the Pacific Ocean no longer is present, having lasted from the winter of 2013 through December of 2015.

February 17, 2016
Waves Above and Below the Water – The Moderate Imaging Spectroradiometer on NASA’s Terra satellite acquired an image of wave patterns in the sky and in the water off the coast of Western Australia.

MODIS image of cloud streets over the Great Lakes.

February 11, 2016
Cloud Streets Over the Great Lakes – MODIS captured this image of cloud streets crossing the Great Lakes.

February 10, 2016
Snow in the Central U.S. – Snow from a blizzard blanketed parts of the Midwest. This image from Terra’s Moderate Imaging Spectroradiometer (MODIS) captured the snow that remained after the clouds cleared over Nebraska.

February 6, 2016
Open- and Closed-Celled Clouds over the Pacific – Terra’s Moderate Imaging Spectroradiometer (MODIS) captured in one image examples of two different types of convective clouds, open-celled and closed-celled.

February 5, 2016
Mount Erebus, Antarctica – Mount Erebus in Antarctica, thought to be the most southern volcano is still active. The Advanced Spaceborne Thermal Emissions and Reflection Radiometer (ASTER) on NASA’s Terra satellite captured images in visible and infrared, showing not just the volcano, but also the lava lake in its interior.

safricandvipa_tmo_201512

February 3, 2016
Drought in Southern Africa – Normalized Difference Vegetation Index (NDVI) data from Terra’s Moderate Imaging Spectroradiometer (MODIS) sensor are being used to track drought conditions in southern Africa, analyzing the effects of the current strong El Niño on vegetation.

Sentinel-3A, the European Space Agency (ESA) – developed Earth observing satellite successfully launched on February 16, 2016. Sentinel-3A is part of Europe’s Copernicus environment program and carries four sensors: The Sea and Land Surface Temperature Radiometer (SLSTR), the Ocean Land Colour Instrument (OLCI), the Synthetic Aperture Radar (SAR) Altimeter, and the microwave radiometer.

Researchers who use Terra MODIS data are particularly interested in OLCI. OLCI images the earth similarly to MODIS on NASA’s Terra and Aqua satellites. It measures specific ocean color, vegetation and atmospheric measurements at 300m spatial resolution and at 1270 km swath width. Sentinel 3A has a morning crossing time like Terra, making Sentinel-3A the most similar to Terra satellite currently flying. Like MODIS data, Sentinel data will be free of charge and provided worldwide.

Congratulations, ESA!

ESA: Sentinel and the Copernicus program

Walong Nature Reserve

Researchers at Michigan State University’s  Center for Systems Integration and Sustainability are combining images from Moderate Resolution Imaging Spectroradiometer (MODIS) and Landsat with information taken on the ground, to increase understanding of how biodiversity is changing in China’s Wolong Nature Reserve, home to the giant panda.

Read the whole article from Michigan State University.

Global temperature anomolies

2015 was the warmest year since modern record-keeping began in 1880, according to a new analysis by NASA’s Goddard Institute for Space Studies. The record-breaking year continues a long-term warming trend — 15 of the 16 warmest years on record have now occurred since 2001. Credits: Scientific Visualization Studio/Goddard Space Flight Center

2015 was the hottest year ever recorded*, but what does Terra have to do with it?

On January 20th, 2016, scientists from NASA’s Goddard Institute for Space Studies (GISS) and National Oceanic and Atmospheric Administration (NOAA) released their analysis based on data gathered on Earth’s surface temperatures. There are two primary sources of data, ground measurements and satellite. While GISS and NOAA studies relied on surface-based measurements, data from satellite instruments, such as those on-board NASA’s Terra satellite are critical for better understanding of global temperatures as a function of time.

“The length and quality of the Terra data record makes it well suited as a check of the global temperature results and can help guide choices on ways to process the surface data,” according the Kurt Thome, Terra project scientist. Three of the Terra sensors have data that are well suited to serve as a validation source, allowing the researchers and scientists to go back and check their data. If surface and satellite measurements are the same, then the scientists responsible for creating the data products can conclude that the product is accurate. This increases confidence in the satellite data’s accuracy as well as verifying that the ground measurements are also accurate. When accurate data is put into the climate models the accuracy of the models is increased.

The Moderate Imaging Spectroradiometer (MODIS) measures Land Surface Temperatures (LST) and Sea Surface Temperatures (SST). There are two MODIS instruments in orbit, one on Terra and the other on Aqua. While the data analyzed in the NASA/NOAA report relies primarily on data from ground stations, the data gathered by MODIS can help “fill in the blanks” of areas where there are not many ground observations available. The data from MODIS, not only can be used to verify that ground instruments are working correctly, but it can also be used to add values to the climate models, that may otherwise be left blank.

The Advanced Spaceborne Thermal Emission and Reflection Radiometer (ASTER) also on NASA’s Terra Satellite, can sense temperature emissions, but at a higher resolution than MODIS.   In fact, ASTER is responsible for the highest resolution global emissivity database. While emissivity isn’t the same as land surface temperature the two are linked because how well a material emits combined with its temperature determines how much energy is given off. When temperatures rise, areas that were once vegetated can become arid causing a change in the emissivity and further changing how energy is distributed between vegetated and arid regions. ASTER, with its narrow swath and high resolution, required several years to create its global emissivity product. Combining the ASTER results with the daily MODIS measurements allows MODIS scientists to retrieve daily LST.

Finally, Clouds and the Earth’s Radiant Energy System (CERES) measures both emitted energy from the earth and solar-reflected energy. Combining these data with the amount of incident solar energy allows CERES scientists to do a full accounting of the Earth’s energy budget. Less reflected energy and greater emitted energy implies a warming planet. CERES, through measuring the amount of energy in the form of heat that is coming from Earth, can be used to validate ground measurements from weather stations. Conversely the ground stations can validate the measurements taken by CERES. Like MODIS and ASTER, this helps increase confidence in the current climate models.

While satellite monitoring of the Earth is relatively new compared the hundreds of years of historic records, satellite data is increasingly being used to help validate the most recent additions to the historic record. Satellite data allows scientists to get global coverage and increase confidence in the data that feeds climate models. Even though Earth is warming, satellite data are better equipped to model the increased temperatures and help citizens and policymakers understand the implications.


Read the press release from NASA GISS and NOAA

Read more on NASA’s Earth Observatory

*modern record keeping began in 1880.

100-remote-sensing-uses-logo-top

Image from GIS Geography. 100 Earth Shattering Uses and Applications of Remote Sensing.

GIS Geography published a list of 100 uses and applications of remote sensing, where data from NASA’s Terra satellite appeared in over 10%.

Listed below are some examples of Terra data uses that made the list (numbered by their original order in the article from GIS Geography):

13. Identifying forest stands and tallying their area to estimate forest supplies (MODIS)

26. Fighting wildfires by planning firefighter dispatch (MODIS)

27. Monitoring air quality in the lower atmosphere (MOPITT)

38. Keeping tabs on the shift from rural to urban growth (MODIS)

39. Quantifying crop conditions with Normalized Difference Vegetation Index (NDVI from MODIS)

59. Monitoring active volcanoes using thermal remote sensing (ASTER, MISR, and MODIS)

66. Looking at the Earth as an art masterpiece NASA’s Earth as Art | NASA Visible Earth

70. Comparing climatic factors from past to present (MODIS, CERES, MOPITT)

75. Studying geology of the Earth’s surface (ASTER, MISR, MODIS)

77. Measuring albedo for Earth’s radiation budget (CERES)

83. Delineating watersheds using DEMs for hydrologists (ASTER)

85. Using a least-cost analysis and vegetation to understand wildebeest migration (NDVI from MODIS)

Read the whole list and learn more about each of the uses and applications of remote sensing at 100 Earth Shattering Remote Sensing Applications Uses from GIS Geography