The Grand Rapids Press out of Grand Rapids Michigan featured an image from MODIS onboard Terra. It clearly shows whispy white fingers erupting off the Great Lakes and blanketing most of Michigan and other surrounding areas in clouds that produced at least 4 inches of snow in some areas. Read the article


The EOS Flagship
Past News
- December 2025
- October 2025
- July 2025
- May 2025
- February 2025
- November 2024
- April 2024
- February 2024
- December 2023
- October 2023
- April 2023
- February 2023
- December 2022
- October 2022
- August 2022
- July 2022
- June 2022
- April 2022
- March 2022
- October 2021
- September 2021
- August 2021
- June 2021
- May 2021
- April 2021
- March 2021
- February 2021
- January 2021
- September 2020
- August 2020
- July 2020
- April 2020
- February 2020
- January 2020
- December 2019
- November 2019
- October 2019
- September 2019
- August 2019
- April 2019
- March 2019
- November 2018
- October 2018
- August 2018
- July 2018
- June 2018
- May 2018
- November 2017
- June 2017
- August 2016
- July 2016
- June 2016
- May 2016
- April 2016
- March 2016
- February 2016
- January 2016
- December 2015
- November 2015
- October 2015
- September 2015
- August 2015
- April 2015
- February 2015
- December 2014
- November 2014
- October 2014
- September 2014
- August 2014
- May 2014
- April 2014
- March 2014
- February 2014
- January 2014
- December 2013
- November 2013
- October 2013
- September 2013
- August 2013
- July 2013
- June 2013
- May 2013
- April 2013
- March 2013
- February 2013
- January 2013
- September 2012
- June 2012
- May 2012
- April 2012
- March 2012
- February 2012
- January 2012
News By Instrument
News By Science
- Air quality
- Applications
- Atmosphere
- Carbon Cycle and Ecosystems
- Climate Variability and Change
- Data
- Earth Observatory
- Earth's Surface and Interior
- Education
- Energy Cycle
- Events
- Human Dimensions
- LAADS DAAC
- Landsat
- Orbital Changes
- Platform
- Resources
- Terra Talent Series
- Terra Visits Camp Landsat
- VIIRS
- Water Cycle
- Weather
- Wildfire
Tag: MODIS
MODIS News and Events
Terra at AGU
Terra and her instruments made an appearance in many of the presentations at the American Geophysical Union’s 46th annual Fall Meeting held December 9th – 13th. Scientists, researchers, students and educators gathered to present groundbreaking research and connect with colleagues.
The presentations showcased the versatility and interconnectedness of the instrument suite onboard Terra.
The presentation, Evaluating MOPITT and ACE Upper-Tropospheric Carbon Monoxide Retrievals with HIPPO In-Situ Measurements showed how MOPITT CO levels were validated and contrasted by the Fourier Transform Spectrometer on board the Atmospheric Chemistry Experiment (ACE-FTS), from the Canadian Space Agency and the Quantum Cascade Laser Spectrometer on the HIAPER Pole to Pole Observations experiment (HIPPO-QCLS).
In Comparing Land Surface and Air Temperatures of Urban Heat Islands Over the Contiguous USA the research team overlaid the National Land Cover Database Impervious Surface Area map over the local air temperatures from the Global Historical Climatology Network station distribution map, identifying over 300 urban settlements and comparing local air temperatures versus the land surface temperatures at night and at midday. They found that the observed temperature change was evident in both sets of data, however the magnitude differed.
Assessment of Urbanization Impact on the Continental US Surface Climate showcased the assessment of interactions between urban and different vegetation classes to understand vegetation control on urband heat islands hourly and seasonal dynamics.
NASA and U.S. Geological Survey Long-Term Archive for the Advanced Spaceborne Thermal Emission and Reflection Radiometer (ASTER) outlines plans for archiving ASTER data through the US Geological Survey.
These were only a few of the presentations at AGU. To attend virtual sessions on demand, search the poster and presentation archive and learn more about how Terra is impacting Earth science visit the AGU fall meeting website.
Comparing Land Surface and Air Temperatures of Urban Heat Islands Over the Contiguous USA
Urban Heat Islands are caused by materials in buildings, parking lots, and other infrastructures in cities that capture and store radiation from the sun. Often these materials are impervious, meaning that no liquid can penetrate directly into the ground. These materials release energy at night in the form of heat. A recent publication presented at American Geophysical Union sought to assess the urban surface heat island signature on land surface temperature change over the United States and make comparisons to local air temperatures provided by the Global Historical Climatology Network. The team used the National Land Cover Database Impervious Surface Area and the MODIS Land Surface Database from 2001 and 2006.
The team overlaid the National Land Cover Database Impervious Surface Area map over the local air temperatures from the Global Historical Climatology Network station distribution map, identifying over 300 urban settlements. They compared the local air temperatures versus the land surface temperatures at night and at midday. They found that the observed temperature change was evident in both sets of data, however the magnitude differed. Local air temperatures from the Global Historical Climatology Network tend to underestimate the surface temperatures during daytime, especially during summer and in non-forested stations.
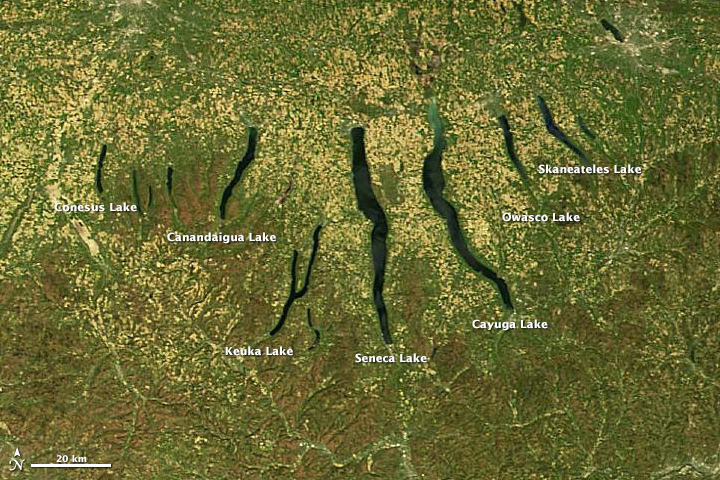
The Icy Origins of the Finger Lakes
 NASA image courtesy of the LANCE/EOSDIS MODIS Rapid Response Team at NASA GSFC. Caption by Adam Voiland.
The Finger Lakes-a group of long, roughly parallel lakes in upstate New York-got their name for obvious reasons. On a map, the narrow lakes look similar to outstretched digits. Seneca and Cayuga-the two largest Finger Lakes-are among the deepest lakes in North America. Lake Cayuga descends about 435 feet (133 meters) at its deepest point-putting it about 53 feet (16 meters) below sea level.
On May 6, 2013, the Moderate-resolution Imaging Spectroradiometer (MODIS) on NASA’s Terra satellite acquired this true-color image of the Finger Lakes. Read more
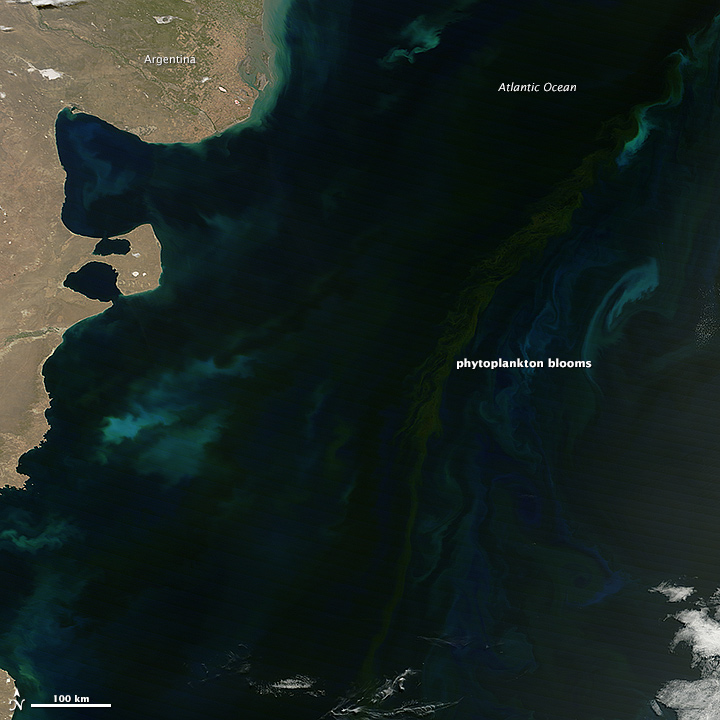
Blooming in the South Atlantic
Offshore from Argentina, spring is in bloom. Massive patches of floating phytoplankton colored the ocean in November 2013. These microscopic, plant-like organisms are the primary producers of the ocean, harnessing sunlight to nourish themselves and to become food for everything from zooplankton to fish to whales.
The Moderate Resolution Imaging Spectroradiometer (MODIS) on NASA’s Terra satellite captured this natural-color image on November 26, 2013. Read more
NASA image by Jeff Schmaltz, LANCE/EOSDIS Rapid Response. Caption by Michael Carlowicz.