Dust and sand storms are not unusual in North Africa and western Asia; in fact, they are a regular part of the region’s rhythm and observed often by satellites. But familiarity does not make them any less extraordinary.
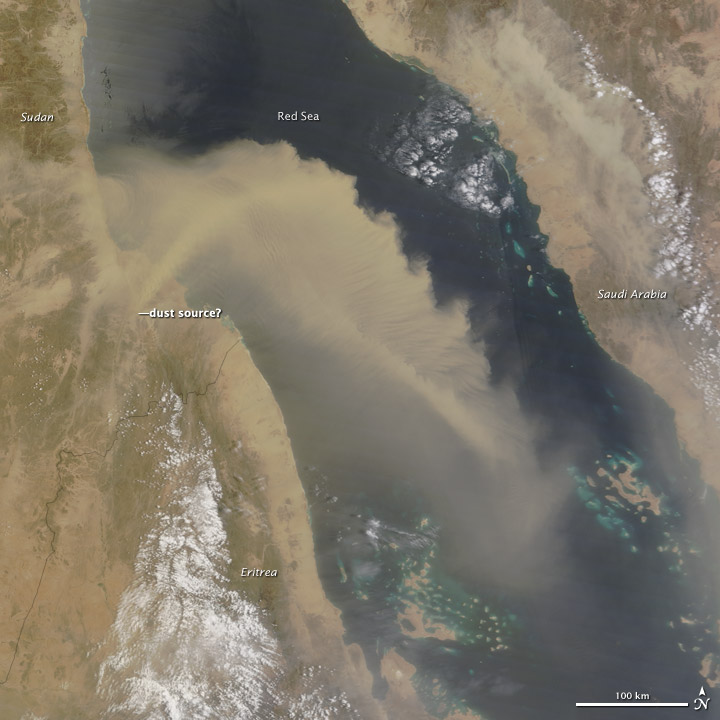
The Moderate Resolution Imaging Spectroradiometer (MODIS) on NASA’s Terra satellite captured this image at 11:25 a.m. local time (0825 Universal Time) on July 7, 2014. A thick plume of dust was blowing out from the dry interior of Sudan and across hundreds of kilometers of the Red Sea, with smaller plumes also visible over Saudi Arabia and Eritrea. Prevailing northwest winds over the water blew the plumes to the southeast. Read more
NASA image courtesy Jeff Schmaltz, LANCE/EOSDIS MODIS Rapid Response Team at NASA GSFC. Caption by Mike Carlowicz.