Tag: MISR

MISR News and Events

Terra is now well into her teenage years, but is by no means setting records for the longest operating satellite.  In fact, Terra has only been collecting data half as long as Landsat 5, which set the record for longest operating satellite last year after operating for 28 years and 10 months.  Terra has surpassed its intended design life by 8 years, but it is still collecting meaningful data, giving scientists insight into how different systems on Earth effect each other.

Beyond Terra’s contributions to scientific research, it continues to help monitor forest fires, equipping land managing agencies with the ability to track a fire’s progress and identify areas of concern.  Terra also continues to witness phytoplankton blooms, monitor changes in ice shelves, witness volcanic eruptions, and track dust, haze and smog as it travels from its source. Terra is improving climate and weather models, helping forecasters make better predictions.

In addition to Terra’s scientific and climate contributions, it continues to showcase how the United States in partnership with other countries, like Japan and Canada, can work together to increase knowledge and gain a better understanding of Earth’s varying climate and the interconnectedness of Earth’s systems. Since Terra’s launch, other satellites such as the Global Precipitation Measurement (GPM), expected to launch in 2014, have followed Terra’s lead by partnering with other countries to provide scientist’s with a wide array of information to better understand Earth.


The Rim Fire, near Yosemite National Park, is quickly becoming one of the largest fires in California history.  The Multi-angle Imaging SpectroRadiometer, MISR onboard Terra uses its nine sensors pointed in different directions to collect data on how sunlight scatters across Earth. MISR captured the extensive, brown smoke emerging from the fire.  This data is helping scientists understand how high these smoke plumes rise, disperse, travel, and ultimately affect air quality in other outlying areas.  NPR published an image of the Rim Fire by MISR as it’s image of the week on Sept. 4, 2013.  Read more


Much has changed since Magellan circumnavigated Earth almost 500 years ago or since the first astronaut orbited Earth over 50 years ago. August 26, 2013 marks another historical event in exploring our earth. Terra, the flagship Earth Observing Satellite, sees the Earth for the 5,000th day celebrating its 5,000th day on orbit.

Terra paved the way for other Earth Observing Satellites through observations made by its five instruments from three countries, MODIS, MISR, and CERES from the United States, ASTER from Japan, and MOPITT from Canada.  Terra is a global partnership, advancing the scientific understanding of our Earth’s processes and changing climate.

MODIS, the MODerate Imaging Spectroradiometer, has captured images of numerous wildfires, hurricanes, and other natural events, while quantifying the amount of vegetation that covers Earth, monitoring sea surface temperature, capturing ocean color, observing the lower atmosphere and providing traceable images of the changing ice sheets. Since its launch in December of 1999 Terra MODIS has supplied irreplaceable data to monitor climate change, improving understanding of global dynamics and processes occurring on Earth.

MISR, the Multi-angle Imaging SpectroRadiometer, monitors Earth from multiple angles at the same time. MISR, the first instrument of its kind, measures the amount of sunlight that is scattered in different directions from Earth’s surface and atmosphere through its suite of nine pushbroom sensors pointed in different directions.  MISR gives depth to what would otherwise be flat images, revealing what lies below the initial surface as seen from space. MISR also distinguishes different types of clouds, particles and surfaces, monitoring trends and contributing to the historical record of a changing climate.

CERES, Clouds and Earth’s Radiant Energy System, on Terra was the second to launch.  The most recent CERES instrument launched in 2011 onboard the Suomi National Polar-orbiting Partnership (NPP) Satellite.  CERES data leads to a better understanding of the role of clouds and the energy cycle in global climate change through taking measurements of incoming and outgoing solar radiation related to cloud properties and physics, enhancing the accuracy of current climate models.

ASTER, Advanced Spaceborne Thermal Emission and Reflection Radiometer, data is used to create detailed maps of land surface temperature, reflectance, and elevation. It is a cooperative effort between NASA, Japan’s Ministry of Economy, Trade and Industry (METI), and Japan Space Systems. Anytime a volcano erupts, ASTER is able to see the thermal fingerprint left by the cascading lava and the warm surface temperature.  ASTER measures infrared radiation and contributes to data sets that reveal more than meets the eye about land use, hydrology, and geologic composition of the land. Its data are used to locate archeologically significant areas, to assist in locating mineral deposits and mapping geologic features, as well as to further the understanding of how humans and natural events change Earth’s surface.  ASTER’s high resolution makes it possible to monitor Earth’s surface at a higher resolution than Terra’s other instruments, enhancing validation and calibration capabilities.

MOPITT, Measurements Of Pollution in The Troposphere, measure tropospheric carbon monoxide (CO) on a global scale. Methane oxidation, fossil fuel consumption and biomass burning produce CO. MOPITT data enables scientists to analyze sources and sinks of CO and track CO’s movement throughout the globe. Through studying this trace gas scientists are able to map CO levels in the lower atmosphere, furthering our understanding of how CO levels change due to both natural and human caused events, ultimately helping understand pollution’s role in climate change.

5,000 days orbiting the Earth is enough to make anyone’s head spin, but Terra has done little to make people dizzy.  Instead, this forerunner in collecting climate science data has paved the way for other satellite missions to clearly understand what changes are occurring on Earth and how they may continue to change well into the future.  As Terra continues into its teenage years, mature for a satellite, it continues to collect measurements that lead to a better understanding of our changing planet.


Resources:

http://www-misr.jpl.nasa.gov

http://asterweb.jpl.nasa.gov

http://ceres.larc.nasa.gov

http://www2.acd.ucar.edu/mopitt

http://modis.gsfc.nasa.gov/


article by Tassia Owen

Dr. Larry Di Girolamo is a Professor and the Daniel Shapiro Professorial Scholar in the Department of Atmospheric Sciences at the University of Illinois at Urbana-Champaign.  He uses data collected from ASTER, MISR, and MODIS to study weather, aerosol and cloud properties.  More recently, he co-authored a paper that reveals high concentration of aerosol over the Indo-Gangetic Basin region in India from data collected by MISR.  In addition to being a prolific author, he also teaches courses in meteorology and satellite remote sensing.  He is frequently ranked as one of excellent teachers at the University.

What do you study?

LDG: I study cloud, aerosol and radiation processes in our atmosphere that occur over a wide range of scales. At larger scales, say from the size of a house to the size of the globe, satellites offer the only viable way to routinely collect observations of cloud and aerosol properties over our planet. And since meteorological satellites only measure electromagnetic radiation incident on its detectors, I spend a lot of my time studying how to convert these radiation measurements into meaningful information on cloud and aerosol.

The term weather and climate are often used interchangeably; can you discuss the difference between the two?

LDG: Weather is the condition of the atmosphere at a given location and time. The condition of the atmosphere is often described in terms of such variables as temperature, pressure, humidity, wind, visibility, cloudiness, and precipitation.

Climate is a statistical summary of the weather at a given location over a long period of time, several decades for example. The statistical summary is often conveyed to the public in terms of the average weather and the weather extremes at a given location over the historic data record.

As an example of weather: on August 25, 2011, at 5:00 pm over Urbana, Illinois, it was sunny with a temperature of 28°C and a relative humidity of 49%.

As an example of climate: the average temperature for the month of January in Chicago, Illinois, is -5.9°C.

You use multiple Terra instruments (ASTER, MISR, and MODIS) to study cloud properties such as cloud-top-heights.  Why is it important to study clouds?

LDG: Sunlight is our ultimate source of energy. Clouds, which cover about 68% of the globe, regulate the incident amount of sunlight reaching the surface and they contribute to the greenhouse effect more than any other atmospheric variable. Clouds are also an important component of the hydrological cycle, coupling the atmosphere and the ground through precipitation. During the life cycle of a cloud, there’s a large exchange of latent heat (the energy associated with a phase change in water) between the cloud and the environment. This exchange of latent heat impacts the dynamics of the atmosphere, hence the evolution of the weather. So clouds play a significant role in weather and climate that impacts our lives.

Given the significant role of clouds, it’s important that we understand their properties, how their properties evolve in space and time, and how to properly treat them within our computer models that make weather and climate predictions. When it comes to numerical weather predictions, the microphysical aspect of cloud and precipitation and associated exchanges of latent heat are leading sources of uncertainty. In climate predictions, the role of clouds remain a leading source of uncertainty for any given anthropogenic change scenario. If we want to reduce our uncertainty in weather and climate predictions, we need to continue to study clouds. Terra provides a great suite of instruments for studying clouds.

You also use MISR to study aerosols.  What role do they play in weather?
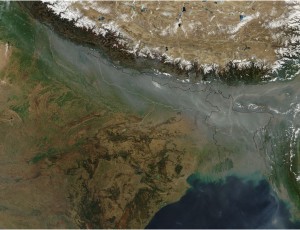
Gray haze builds along the front of the Himalaya Mountains in northern India in this MISR image.

LDG: To a lesser extent than clouds, aerosols also regulate the amount of sunlight reaching the ground. For example, in the absence of fog, it is the variability in aerosols that contribute the most to the variability in visibility. But perhaps more importantly in terms of their role in weather, is the fact that water vapor condenses onto aerosols to form clouds at a relative humidity near 100%. Without aerosols, hundreds of percent relative humidity is required for water vapor to condense to form clouds. So without aerosols, there would be very few clouds. Fortunately, there are plenty of aerosols provided by nature. The properties of these aerosols can modulate the properties of clouds, including the microphysical properties of clouds, rain production, cloud cover, and cloud lifetimes. There are also cloud processes that modify aerosol properties. This interaction between cloud and aerosol properties is currently a hot topic in atmospheric science research, and Terra data continues to contribute greatly toward our understanding of this interaction.

Another role that aerosols play is in the quality of air that we breathe. The acute and chronic health impacts, predominately to our respiratory and cardiovascular systems, from short and long-term exposure to aerosols are now well established. The World Health Organization has established air quality guidelines, which includes exposure levels in terms of the size range of airborne particulate matter. The particle size is a determinant in where and how it gets deposited in the respiratory system.   Since most humans live on land, observing aerosols over land is of primary importance. Before the launch of MISR, there were no good, quantitative satellite observations of aerosol properties over land. MISR was designed to provide information on the size and shapes of aerosols over water and land. With more than a decade of MISR data, we are beginning to see from space how the aerosol field changes due to natural events and human activities.

As you know Terra has five instruments that monitor various components that make up the Earth System.  Can you explain the dynamics among weather, land and oceans?

LDG: There are too many details to answer this question properly. So I can only answer in a very generic sense. Basically, the atmosphere, land, and oceans store and exchange heat and momentum. They also exchange moisture, and many types of gases and aerosols.  Ultimately, it is the uneven distribution of these quantities over the globe that forces the exchange of these quantities between land, ocean and atmosphere. The dynamics involved in this exchange manifest themselves to us in terms of weather, ocean currents, a changing biosphere (e.g., desertification), etc.  Terra provides a broad range of measurements necessary to make advancements in our understanding on how these exchanges take place from regional to global scales.

And, finally how did you get interested in science and, then, decided to study weather?

LDG: NASA’s Viking mission beamed back spectacular true color images of Mars. I was a kid when I first looked at those images – it completely reshaped and redirected my thinking. The visual cue of true color images from another planet was absolutely awesome. I was also a fan of Star Trek. So I enrolled as an undergraduate student in Astrophysics and later as a graduate student in Atmospheric Sciences. I became aware of environmental problems we faced on our planet and the challenges in observing Earth from space. I wanted to help, but I still wanted to work from the vantage point of space. I was fortunate to be part of the Terra mission. When MISR and MODIS beamed back wide-swath true-color images of Earth, I got that same awesome feeling as when I first looked at Viking images. And when we fused the multiple-views from MISR to produce 3-D images”¦ it was like floating in space!

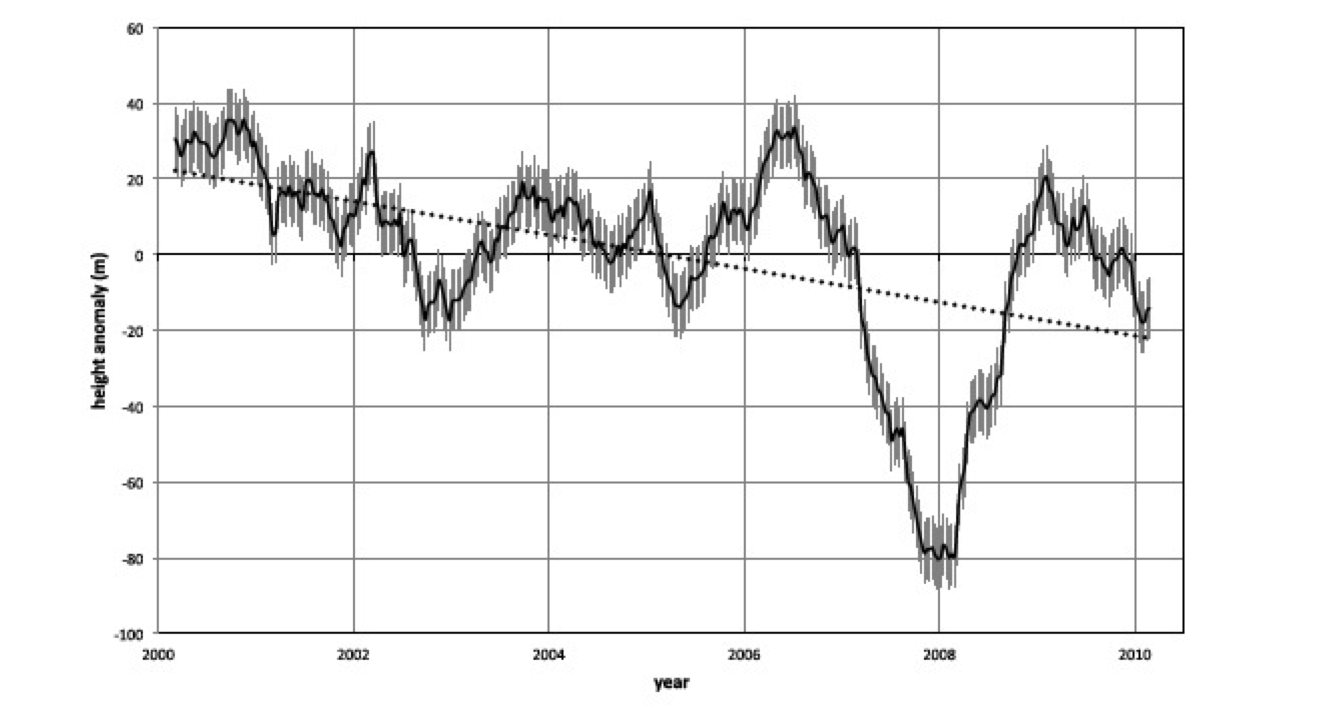
Deseasonalized anomalies of global effective cloud-top height from the 10-year mean. Solid line: 12-month running mean of 10-day anomalies. Dotted line: linear regression. Gray error bars indicate the sampling error (±8 m) in the annual average.

Stereo measurements from the Multiangle Imaging SpectroRadiometer (MISR) on the Terra satellite show a decrease in global cloud height between March 2000 and February 2010. MISR records the height of the top, thick cloud (not thin clouds), the cloud layer that has he greatest influence on radiating longwave radiation (heat) to space. Lower clouds radiate more energy than higher clouds, so a drop in cloud height could help counter rising global temperatures. In this analysis, the change in cloud height was calculated by comparing heights for a given 10-day period with the average global height calculated for that time of year over the ten-year period. The greatest change-a drop of 80 meters below average-occurred in 2007 and 2008, during a strong La Niña event. The height difference between the 2000 and 2010 is 31 meters.  The observed trend is strongly influenced by the La Niña event and may disappear over time. If the trend persists, it would represent a strong negative feedback to global warming.


Davies, R. and Molloy, M. (2012, February 3). Global cloud height fluctuations measured by MISR on Terra from 2000 to 2010. Geophysical Research Letters, 39, L03701.