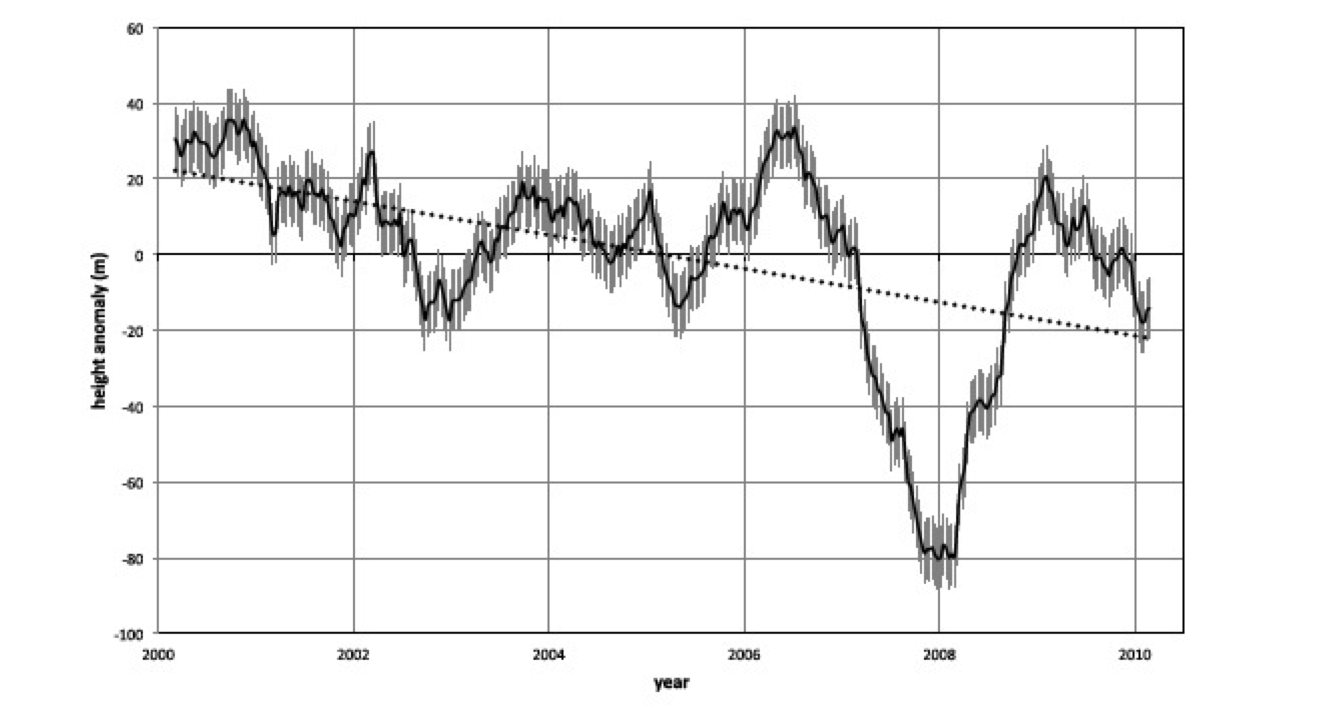
Deseasonalized anomalies of global effective cloud-top height from the 10-year mean. Solid line: 12-month running mean of 10-day anomalies. Dotted line: linear regression. Gray error bars indicate the sampling error (±8 m) in the annual average.
Stereo measurements from the Multiangle Imaging SpectroRadiometer (MISR) on the Terra satellite show a decrease in global cloud height between March 2000 and February 2010. MISR records the height of the top, thick cloud (not thin clouds), the cloud layer that has he greatest influence on radiating longwave radiation (heat) to space. Lower clouds radiate more energy than higher clouds, so a drop in cloud height could help counter rising global temperatures. In this analysis, the change in cloud height was calculated by comparing heights for a given 10-day period with the average global height calculated for that time of year over the ten-year period. The greatest change-a drop of 80 meters below average-occurred in 2007 and 2008, during a strong La Niña event. The height difference between the 2000 and 2010 is 31 meters. The observed trend is strongly influenced by the La Niña event and may disappear over time. If the trend persists, it would represent a strong negative feedback to global warming.
Davies, R. and Molloy, M. (2012, February 3). Global cloud height fluctuations measured by MISR on Terra from 2000 to 2010. Geophysical Research Letters, 39, L03701.


