Tag: ASTER

ASTER News and Events

The Advanced Spaceborne Thermal Emission and Reflection Radiometer (ASTER) is a 15-channel imaging instrument operating on NASA’s Terra satellite. A joint project between the U.S. National Aeronautics and Space Administration and Japan’s Ministry of Economy, Trade, and Industry, ASTER has been acquiring data for 15 years, since March 2000. The archive now contains over 2.8 million scenes; for the majority of them, a stereo pair was collected using nadir and backward telescopes imaging in the NIR wavelength.The majority of users require only a few to a few dozen scenes for their work. Studies have ranged over numerous scientific disciplines, and many practical applications have benefited from ASTER’s unique data. A few researchers have been able to mine the entire ASTER archive, that is now global in extent due to the long duration of the mission. Six examples of global products are described in this contribution:the ASTER Global Digital Elevation Model (GDEM), the most complete, highest resolution DEM available to all users; the ASTER Emissivity Database (ASTER GED), a global 5-band emissivity map of the land surface; the ASTER Global Urban Area Map (AGURAM), a 15-m resolution database of over 3500 cities;the ASTER Volcano Archive (AVA), an archive of over 1500 active volcanoes; ASTER Geoscience products of the continent of Australia; and the Global Ice Monitoring from Space (GLIMS) project.

Access the complete article on International Journal of Applied Earth Observation and Geoinformation

ASTER GED with Death Valley


ASTER GED Death Valley Color Bar

Image Credit: NASA/GSFC/METI/ERSDAC/JAROS, and U.S./Japan ASTER Science Team

Like the sun, Earth emits energy, yet this energy cannot be seen. Instead, it can be felt as heat because it is emitted in the thermal infrared wavelength range of the electromagnetic spectrum. While some energy in the electromagnetic spectrum can be seen in the form of light, other energy can only be felt as heat. For example, if you stand next to an oven or hover your hand over a hot burner you can feel the heat being emitted without directly touching either appliance. The strength of the energy emitted depends on both the temperature of the surface and how efficiently it can emit radiation, known as its emissivity.

The emissivity of most natural Earth surfaces is a unitless quantity and ranges between approximately 0.6 and 1.0, but surfaces with emissivities less than 0.85 are typically restricted to deserts and semi-arid areas. Vegetation, water and ice have high emissivities, above 0.95 in the thermal infrared wavelength range.

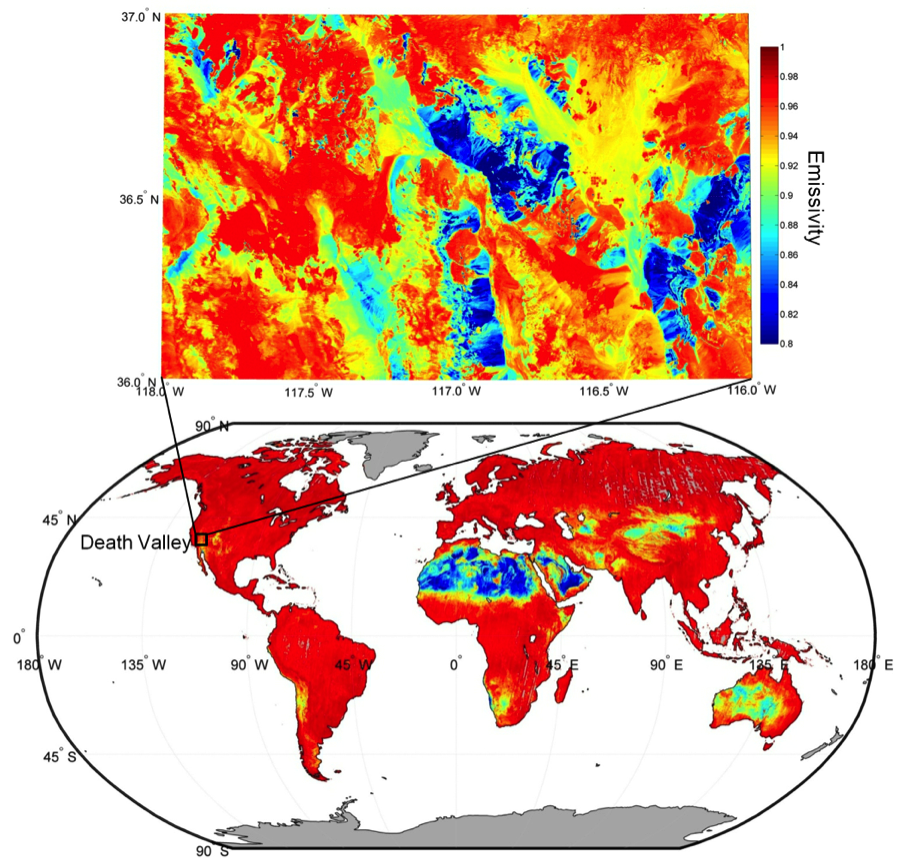
Instruments sensitive to thermal infrared radiation on-board NASA’s Earth Observing Satellites are designed to calculate Earth’s emissivity. The Advance Spaceborne Thermal Emission and Reflection Radiometer (ASTER) on-board Terra is one of these instruments. It calculates emissivity at 90 m spatial resolution for five different wavelengths in the thermal infrared spectrum. Scientists at NASA’s Jet Propulsion Laboratory in Pasadena, California produced the most detailed global map of emissivity by compositing millions of clear-sky images from ASTER, collected since its launch in 2000. This global map is the ASTER Global Emissivity Database (ASTER GED). ASTER GED is approximately 100 times more detailed than any other previous emissivity map produced by NASA.

Emissivity, unlike surface temperature, is an intrinsic property of the surface and does not depend on the angle of the sun in relationship to Earth or on local weather conditions. Instead emissivity variations occur due to land cover and use changes, as well as, the mineral composition of the land’s surface.

In the image, red areas (>0.95) have high emissivity and are covered with large amounts of vegetation, water, or ice. Blue areas (<0.8) have low emissivity and are indicative of quartz sands, which are found in arid regions such as the Sahara Desert in northern Africa. Transition areas from desert regions to more heavily vegetated regions, such as in the Sahel in Africa, appear green and yellow.

ASTER GED is a global, 90m spatial resolution emissivity map of the Earth’s non-frozen land surfaces at five different wavelengths in the thermal infrared spectrum. ASTER along with the Moderate Resolution Imaging Spectroradiometer (MODIS) on-board both Terra and Aqua and the Atmospheric Infrared Sounder (AIRS) on-board Aqua measure thermal infrared radiation. Therefore, the high resolution ASTER GED can be used to calibrate and validate these instruments coarser resolution estimates of emissivity at the kilometer-scale. ASTER GED is also being used for improving estimates of Earth’s surface temperature, atmospheric water vapor, and the accuracy of climate models, which currently have large uncertainties in their use of emissivity information.

Resources:

Jet Propulsion Laboratory Photojournal. (2014, October 20). NASA Spacecraft Maps Earth’s Global Emissivity. accessed October 23, 2014.

Land Processes Distributed Active Archive Center. (2014, April 2). ASTER Global Emissivity Database (GED) Product Release. Accessed October 7, 2014.

Joint Emissivity Database Initative (JEDI) Accessed October 7, 2014

ASTER-GED. Accessed October 23, 2014

Student winners of NASA’s 2014 educational “REEL Science Communication Contest” have completed their follow-on Earth science videos after a month-long workshop with NASA scientists and communication experts.

In May of 2014, NASA Earth science missions at NASA’s Goddard Space Flight Center in Greenbelt, Maryland, selected winners of their second annual video contest for high school students. The student winners each produced two-minute videos that communicate NASA Earth science to engage younger students. Winners were awarded the opportunity to work remotely with NASA experts to create new Earth science videos for NASA outreach.

Throughout July, contest winners Lena Korkeila from Placerville, California; Anna and Geof Olson from Santa Cruz, California; and Heather Forster, Sofia Bialkowski and Suzie Petryk from Huntington, New York, learned about NASA Earth science missions, communication efforts and video production.  Working with people from the Terra, Aqua and ICESat-2 Earth science missions and Goddard’s Office of Communications, the students pitched video ideas, wrote their scripts, identified NASA footage and visualizations, found or created accompanying music and recorded their narrations. Read more

palouse_ast_2008205

NASA image created by Jesse Allen, using data provided courtesy of NASA/GSFC/METI/ERSDAC/JAROS, and U.S./Japan ASTER Science Team. Caption by Adam Voiland.

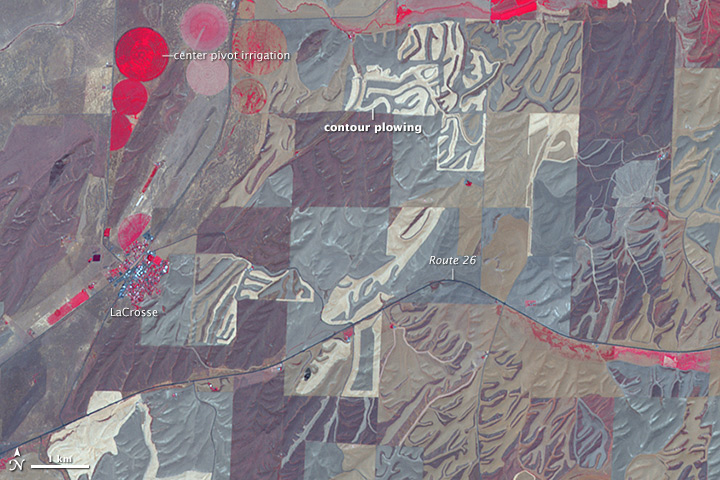
The Advanced Spaceborne Thermal Emission and Reflection Radiometer (ASTER) on NASA’s Terra satellite captured this image of farmland near LaCrosse, Washington, on July 24, 2008. The false-color image was assembled using infrared, red, and green wavelengths of light. This combination is useful for observing vegetation and monitoring its health. Areas with the most vigorous crops, grasses, and trees are bright red. Areas where vegetation is drying or dormant are darker shades of brown and gray. Areas with no red are likely fallow or being prepared for seeding. Read more

california_ast_2011095

In its weekly report issued on July 31, the U.S. Drought Monitor reported that 82 percent of the state of California was in an extreme drought and 58 percent was in exceptional drought—up from 79 and 36 percent just two weeks ago. The drying of farmlands and suburbs is mirrored by the shrinking of the state’s reservoirs.

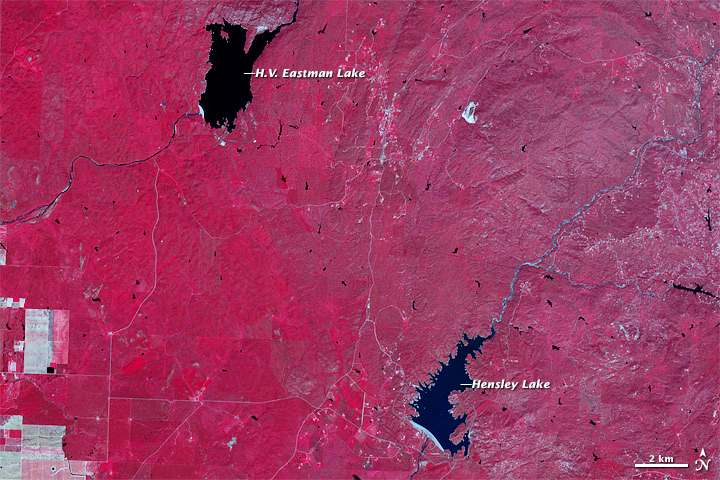
The Advanced Spaceborne Thermal Emission and Reflection Radiometer (ASTER) instrument on NASA’s Terra spacecraft captured these false-color views of central California on April 5, 2011 (top), and May 15, 2014. ASTER collects data in infrared, red, and green wavelengths of light, which are then combined to make false-color images where vegetation appears red; buildings and roads are white and gray; water is dark blue; and dry, barren land is tan. Read more

NASA Earth Observatory image by Jesse Allen, using data from NASA/GSFC/METI/ERSDAC/JAROS, and U.S./Japan ASTER Science Team. Caption by Michael Carlowicz.