Month: December 2013

Urban Heat Islands are caused by materials in buildings, parking lots, and other infrastructures in cities that capture and store radiation from the sun.  Often these materials are impervious, meaning that no liquid can penetrate directly into the ground. These materials release energy at night in the form of heat.  A recent publication presented at American Geophysical Union sought to assess the urban surface heat island signature on land surface temperature change over the United States and make comparisons to local air temperatures provided by the Global Historical Climatology Network. The team used the National Land Cover Database Impervious Surface Area and the MODIS Land Surface Database from 2001 and 2006.

The team overlaid the National Land Cover Database Impervious Surface Area map over the local air temperatures from the Global Historical Climatology Network station distribution map, identifying over 300 urban settlements.  They compared the local air temperatures versus the land surface temperatures at night and at midday. They found that the observed temperature change was evident in both sets of data, however the magnitude differed. Local air temperatures from the Global Historical Climatology Network tend to underestimate the surface temperatures during daytime, especially during summer and in non-forested stations.

Measurements Of Pollution In The Troposphere (MOPITT) instrument on board NASA’s Terra satellite measures carbon monoxide (CO) in the troposphere, the lowest portion of Earth’s atmosphere, ranging from sea level up to 20 km at the equator and 7 km near the poles. There are few in situ profiles, measurements that are taken from the natural position rather than remotely, that reach into the upper troposphere (UT), limiting understanding of MOPITT performance at that atmospheric level. It is important for any data collected by satellites to be validated against other existing data to ensure that the information being collected is accurate and applicable.

In a recent poster presented at the American Geophysical Union Conference, MOPITT CO levels were validated and contrasted by the Fourier Transform Spectrometer on board the Atmospheric Chemistry Experiment (ACE-FTS), from the Canadian Space Agency and the Quantum Cascade Laser Spectrometer on the HIAPER Pole to Pole Observations experiment (HIPPO-QCLS).  ACE-FTS has been monitoring the upper troposphere since 2004, providing data for much of the same time as MOPITT and HIPPO-QCLS data has high resolution, precision, and accuracy from its in situ measurements, making it an ideal source for validating the MOPITT measurements.

NASA image courtesy of the LANCE/EOSDIS MODIS Rapid Response Team at NASA GSFC. Caption by Adam Voiland. NASA image courtesy of the LANCE/EOSDIS MODIS Rapid Response Team at NASA GSFC. Caption by Adam Voiland.

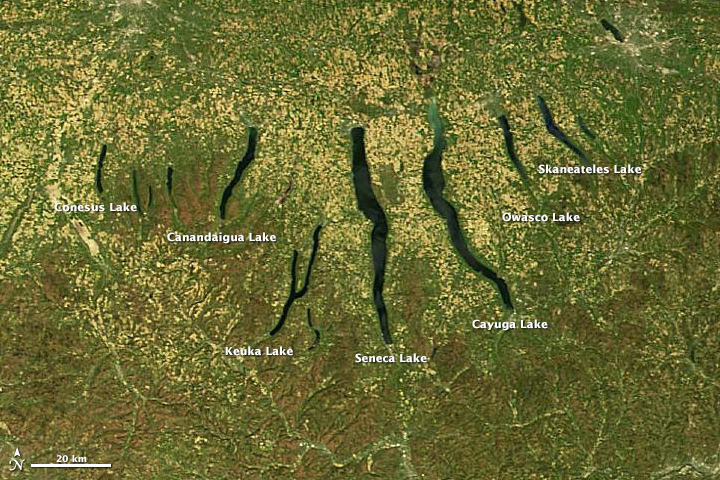
The Finger Lakes-a group of long, roughly parallel lakes in upstate New York-got their name for obvious reasons. On a map, the narrow lakes look similar to outstretched digits. Seneca and Cayuga-the two largest Finger Lakes-are among the deepest lakes in North America. Lake Cayuga descends about 435 feet (133 meters) at its deepest point-putting it about 53 feet (16 meters) below sea level.

On May 6, 2013, the Moderate-resolution Imaging Spectroradiometer (MODIS) on NASA’s Terra satellite acquired this true-color image of the Finger Lakes. Read more

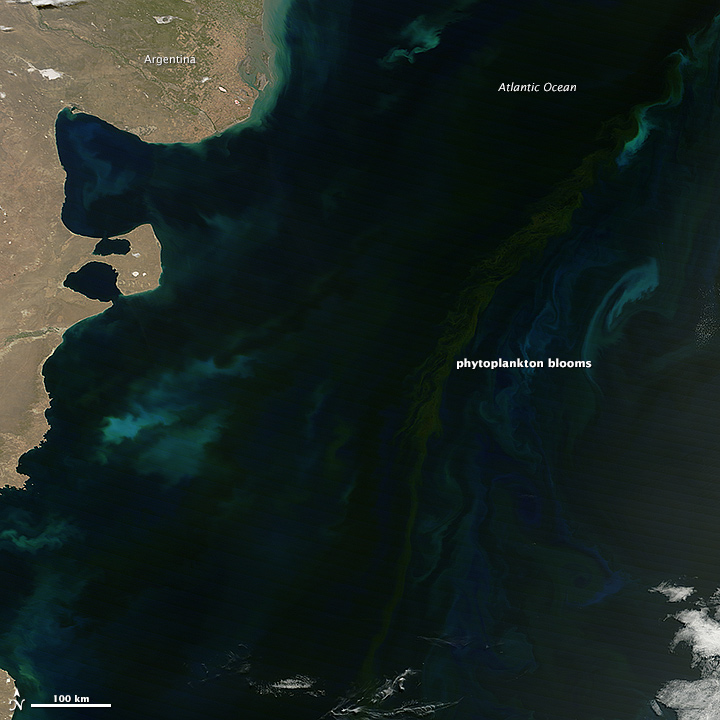
Offshore from Argentina, spring is in bloom. Massive patches of floating phytoplankton colored the ocean in November 2013. These microscopic, plant-like organisms are the primary producers of the ocean, harnessing sunlight to nourish themselves and to become food for everything from zooplankton to fish to whales.

The Moderate Resolution Imaging Spectroradiometer (MODIS) on NASA’s Terra satellite captured this natural-color image on November 26, 2013. Read more

 NASA image by Jeff Schmaltz, LANCE/EOSDIS Rapid Response. Caption by Michael Carlowicz.
NASA image by Jeff Schmaltz, LANCE/EOSDIS Rapid Response. Caption by Michael Carlowicz.

NASA MODIS image courtesy Jeff Schmaltz LANCE/EOSDIS MODIS Rapid Response Team, GSFC. Mather Point photograph courtesy Grand Canyon National Park. GOES images courtesy NOAA-NASA GOES Project. NASA Earth Observatory animation by Robert Simmon. Caption by Holli Riebeek. NASA

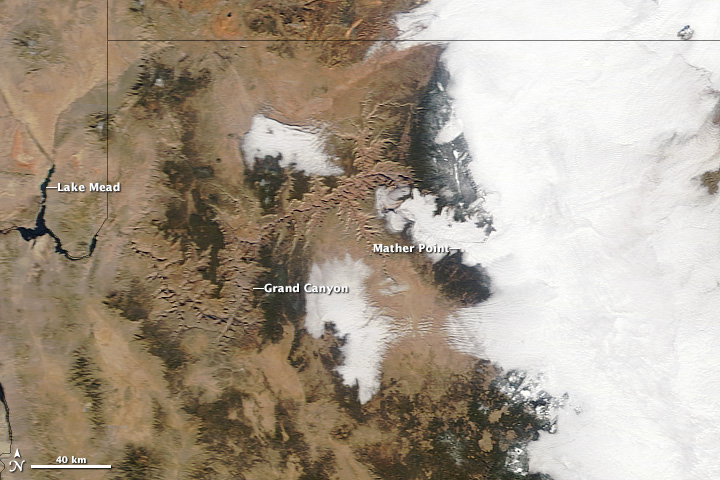
The Grand Canyon stuns visitors with breathtaking views every day. Between November 29 and December 2, 2013, it stunned visitors even more by not being visible. A rare meteorological event filled the canyon with an ocean of clouds. Such events are so rare that National Park Service rangers-who see the canyon every day-wait for years to see the ground-hugging fog.

The 2013 fog event was unusual because of its extent, as shown in the second image, captured by the Moderate Resolution Imaging Spectroradiometer (MODIS) on NASA’s Terra satellite. Read more

MODIS image courtesy Jeff Schmaltz LANCE/EOSDIS MODIS Rapid Response Team, GSFC. Mather Point photograph courtesy Grand Canyon National Park. GOES images courtesy NOAA-NASA GOES Project. NASA Earth Observatory animation by Robert Simmon. Caption by Holli Riebeek.