Author: Tassia Owen

NASA Earth Observatory image by Jesse Allen, using data from the Level 1 and Atmospheres Active Distribution System (LAADS). Caption by Adam Voiland, with information from Paul Newman (NASA Goddard), Marshall Shepherd (University of Georgia), and John Knox (University of Georgia).

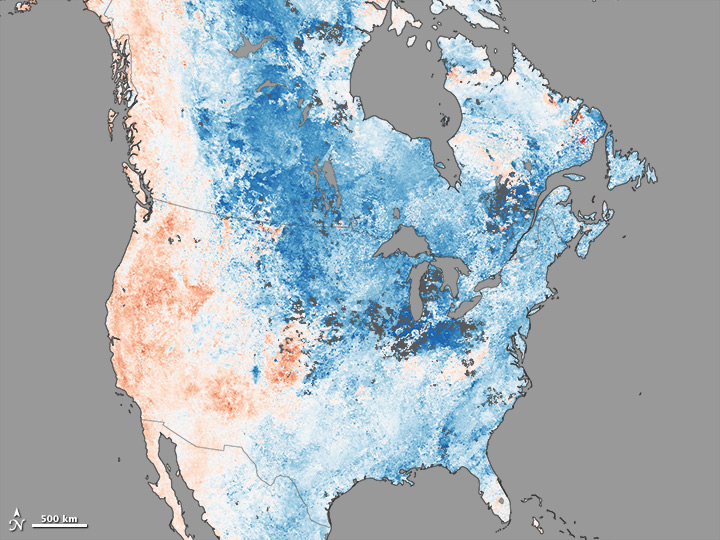
The map above shows land surface temperature anomalies in North America for January 1-7, 2014. Based on data from the Moderate Resolution Imaging Spectroradiometer (MODIS) on NASA’s Terra satellite, the map depicts temperatures for that period compared to the 2001-2010 average for the same week. Areas with warmer than average temperatures are shown in red; near-normal temperatures are white; and areas that were cooler than the base period are blue. Gray indicates areas where clouds blocked the satellite from collecting usable data. While much of the United States was experiencing frigidly cold temperature, Sochi Russia was warmer than average.  Read more

NASA Earth Observatory image by Jesse Allen, using data from the Level 1 and Atmospheres Active Distribution System (LAADS). Caption by Adam Voiland, with information from Paul Newman (NASA Goddard), Marshall Shepherd (University of Georgia), and John Knox (University of Georgia).

NASA Earth Observatory image courtesy Jeff Schmaltz LANCE/EOSDIS MODIS Rapid Response Team, GSFC. Caption by Adam Voiland.

In the midst of a cold snap that sent temperatures 20-40°F (11-22°C) below normal across much of the United States, the Moderate Resolution Imaging Spectroradiometer (MODIS) on the Terra satellite captured an image of cloud streets over the Atlantic Ocean on January 7, 2014. Read more

NASA Earth Observatory image courtesy Jeff Schmaltz LANCE/EOSDIS MODIS Rapid Response Team, GSFC. Caption by Adam Voiland.

NASA Earth Observatory image by Jesse Allen, using data from the Level 1 and Atmospheres Active Distribution System (LAADS). Caption by Holli Riebeek.

2013 turned out to be Australia’s hottest year on record. Fittingly, the calendar year both started and ended with intense heat waves. The most recent heat wave peaked between December 27, 2013, and January 4, 2014. The heat raised land surface temperatures (LSTs) that are monitored by the Moderate Resolution Imaging Spectroradiometer (MODIS) on NASA’s Terra satellite. Read more

NASA Earth Observatory image by Jesse Allen, using data from the Level 1 and Atmospheres Active Distribution System (LAADS). Caption by Holli Riebeek.

NASA Earth Observatory image by Jesse Allen, using data from the Level 1 and Atmospheres Active Distribution System (LAADS). Caption by Holli Riebeek.

A deadly heatwave left its signature on the land in Argentina. This map shows land surface temperatures between December 19-26, 2013, compared to average temperatures for the same period from 2000-2012. Nearly the entire country was much warmer than normal, with some locations more than 15°Celsius above average.

Argentina was in the midst of an intense two-week heatwave when the data for the map was acquired by the Moderate Resolution Imaging Spectroradiometer (MODIS) on NASA’s Terra satellite. Read more

NASA Earth Observatory image by Jesse Allen, using data from the Level 1 and Atmospheres Active Distribution System (LAADS). Caption by Holli Riebeek.

NASA Earth Observatory images by Jesse Allen and Robert Simmon, using data from LANCE/EOSDIS Rapid Response. Caption by Adam Voiland.

On January 6, 2014, the Moderate Resolution Imaging Spectroradiometer MODIS on NASA’s Terra satellite captured this natural-color image (top) of fog forming over the lakes and streaming southeast with the wind.  A swirling mass of Arctic air moved south into the continental United States in early January 2014. On January 3, the air mass began breaking off from the polar vortex, a semi-permanent low-pressure system with a center around Canada’s Baffin Island. The frigid air was pushed south into the Great Lakes region by the jet stream, bringing abnormally cold temperatures to many parts of Canada and the central and eastern United States. Read more

NASA Earth Observatory images by Jesse Allen and Robert Simmon, using data from LANCE/EOSDIS Rapid Response. Caption by Adam Voiland.