Author: Tassia Owen

NASA Earth Observatory image (top) by Joshua Stevens using Landsat data from the U.S. Geological Survey and ASTER GDEM2 data from NASA/MITI and the ASTER Science Team.

NASA Earth Observatory image (top) by Joshua Stevens using Landsat data from the U.S. Geological Survey and ASTER GDEM2 data from NASA/MITI and the ASTER Science Team.

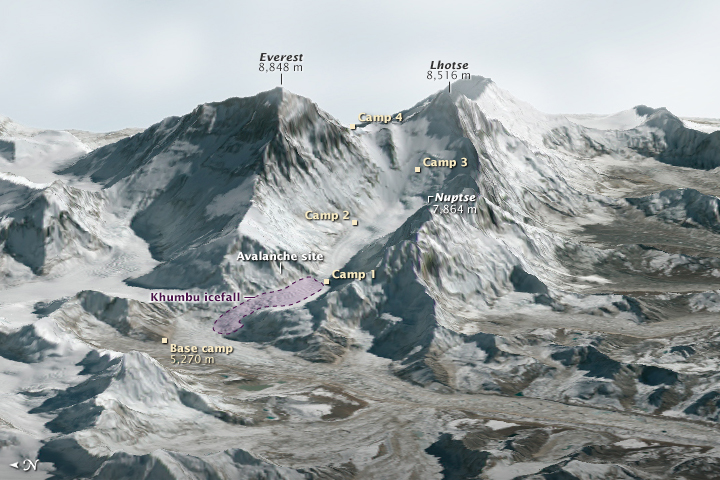
At approximately 6:45 a.m. on April 18, 2014, a block of ice tumbled from the edge of a hanging glacier onto a popular climbing route on the south face of Mount Everest. The ice, which weighed as much as 657 passenger buses, tumbled about 400 meters (1,300 feet) and triggered an avalanche. The falling ice and rock overwhelmed a group of Nepalese guides who were ferrying equipment from Base Camp (elevation 5,270 meters) to Camp 1 (elevation 6,035 meters) for foreign clients. Sixteen guides died in the avalanche, making it Everest’s deadliest day.

This three-dimensional rendering—made with data collected by the Operational Land Imager on Landsat 8 and the Advanced Spaceborne Thermal Emission and Reflection Radiometer (ASTER) on Terra—offers a broad view of the topography that climbers face. Read More

NASA image by Jeff Schmaltz, LANCE/EOSDIS Rapid Response. Caption by Kathryn Hansen.

NASA image by Jeff Schmaltz, LANCE/EOSDIS Rapid Response. Caption by Kathryn Hansen.

Spring and summer are the prime seasons for dust storms in China’s Taklimakan Desert. On April 1, 2015, the Moderate Resolution Imaging Spectroradiometer (MODIS) on NASA’s Terra satellite captured this natural-color image of dust from the desert and from the greater Tarim Basin.

The Tarim is bordered by the Tian Shan mountains to the north (obscured by clouds in this image) and the Kunlun Shan mountains to the south. The basin opens up on its east side, but that’s not necessarily an escape route for dust. The prevailing low-altitude winds come from the east, keeping most dust below 5 kilometers—about the height of the mountain ranges—and confined to the desert. Read more

ASTER_first_An_v2Fifteen years ago this month the Advanced Spaceborne Thermal Emission and Reflection Radiometer (ASTER) sensor onboard NASA’s Terra satellite began returning images. The first image from ASTER’s thermal infrared (TIR) subsystem was captured on March 3, 2000 of the western edge of the volcanic Afar Triangle in Ethiopia (see image to the right). This image represents not only ASTER’s first thermal image, but also the first high resolution multispectral thermal data collected by a sensor on a satellite. Since this first image 15 years ago, ASTER data has continued to be valuable to geologic and volcanic applications, as well as many other scientific disciplines.

Read the full article

The Advanced Spaceborne Thermal Emission and Reflection Radiometer (ASTER) is a 15-channel imaging instrument operating on NASA’s Terra satellite. A joint project between the U.S. National Aeronautics and Space Administration and Japan’s Ministry of Economy, Trade, and Industry, ASTER has been acquiring data for 15 years, since March 2000. The archive now contains over 2.8 million scenes; for the majority of them, a stereo pair was collected using nadir and backward telescopes imaging in the NIR wavelength.The majority of users require only a few to a few dozen scenes for their work. Studies have ranged over numerous scientific disciplines, and many practical applications have benefited from ASTER’s unique data. A few researchers have been able to mine the entire ASTER archive, that is now global in extent due to the long duration of the mission. Six examples of global products are described in this contribution:the ASTER Global Digital Elevation Model (GDEM), the most complete, highest resolution DEM available to all users; the ASTER Emissivity Database (ASTER GED), a global 5-band emissivity map of the land surface; the ASTER Global Urban Area Map (AGURAM), a 15-m resolution database of over 3500 cities;the ASTER Volcano Archive (AVA), an archive of over 1500 active volcanoes; ASTER Geoscience products of the continent of Australia; and the Global Ice Monitoring from Space (GLIMS) project.

Access the complete article on International Journal of Applied Earth Observation and Geoinformation

Hagupit_tmo_2014338

The twenty-second tropical weather system (and eleventh typhoon) of the year in the Western Pacific Ocean had the potential to be one of the most damaging of 2014. In early December, Hagupit approached The Philippines as a major and slow-moving typhoon that threatened to hit the islands with torrential rain and a large storm surge. Hundreds of thousands of people were evacuated in the lead-up to the storm on December 5.

The Moderate Resolution Imaging Spectroradiometer (MODIS) on NASA’s Terra satellite acquired this image at 11:20 a.m. Palau time (0210 Universal Time) on December 4, 2014. At the time, Hagupit was a category 5 super typhoon with sustained winds of 155 knots (180 miles or 290 kilometers per hour). It was the fourth category 5 typhoon of the year in the Western Pacific.

read more