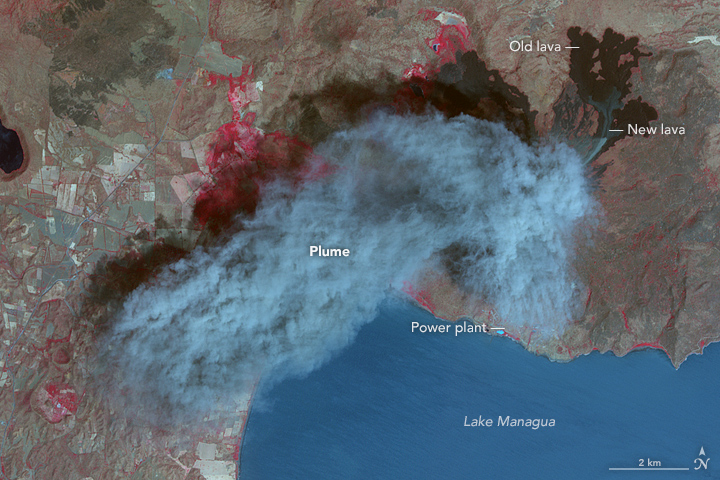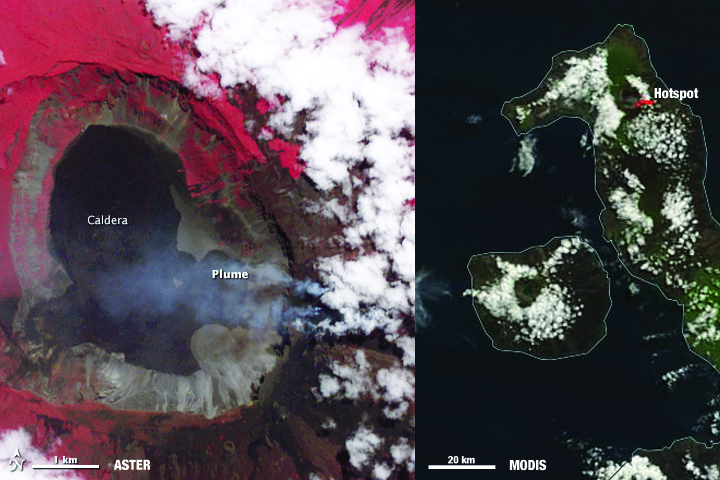
Images of Wolf volcano on June 11, 2015. ASTER image (left) shows Wolf Volcano in great detail. MODIS image (right) red marks indicate temperature anomalies or hot spots. Image Credit: Aster image from NASA Earth Observatory by Jesse Allen, using data from NASA/GSFC/METI/ERSDAC/JAROS, and U.S./Japan ASTER Science Team. MODIS image from NASA Worldview.
Not every volcano is as closely observed as Mount Saint Helens in Washington state or Mount Kilauea of Volcanoes National Park in Hawaii. These active volcanoes are closely monitored with specialized instruments dedicated to monitoring signs of volcanic activity. They are the exception, not the norm. Many volcanoes are remotely located and poorly monitored. However, NASA’s Terra satellite is helping identify potentially active volcanoes, better equipping surrounding communities to evacuate or take precautions before their local volcano erupts.
Two instruments on NASA’s Terra satellite, the Moderate Imaging Spectroradiometer (MODIS) and the Advanced Spaceborne Thermal Emissions and Reflection Radiometer (ASTER), along with instruments on other NASA and NOAA satellites are being used to identify and monitor potential areas of volcanic activity as part of the Urgent Request Protocol.
Not one satellite can do it all. “Monitoring of active volcanic processes using spaceborne data commonly requires different temporal, spatial and spectral scales depending on the science goal and process being observed,” according to Michael Ramsey from the University of Pittsburgh in his recent article, published on December 17, 2015.
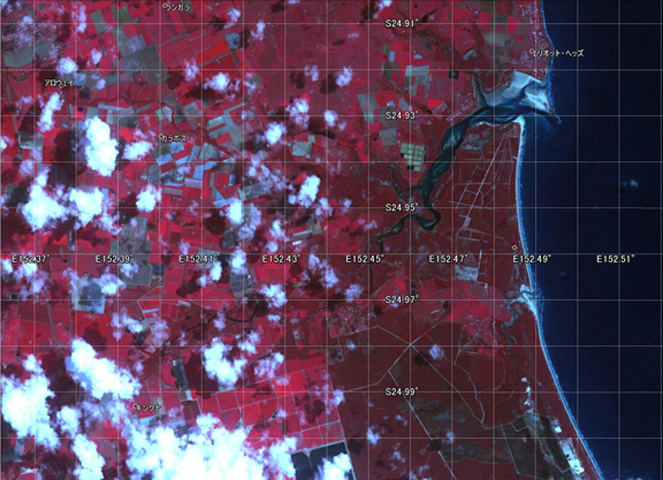
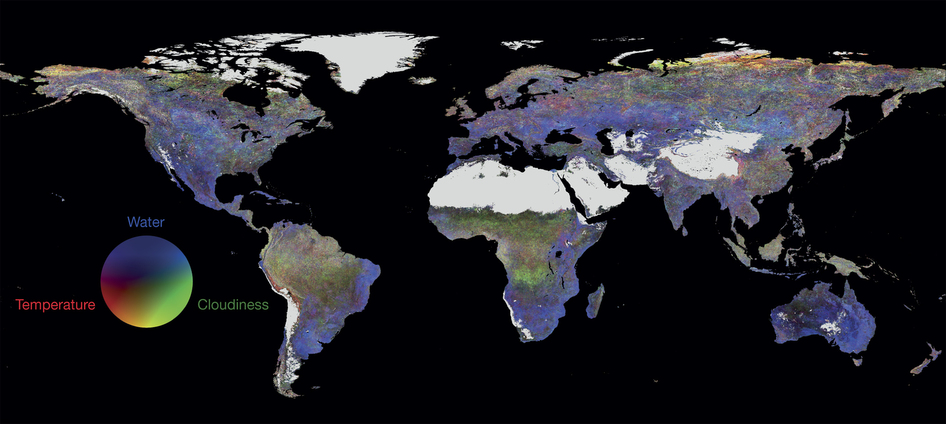
Hotspots on Earth are identified by satellite images that have a thermal sensor, which measures the temperature, or infrared radiation, of Earth’s surface.MODIS, the Advanced Very High Resolution Radiometer (AVHRR) and ASTER all collect data on Earth’s temperature, but each of these sensors have different spatial resolutions. MODIS and AVHRR image large areas frequently, but lack detail. ASTER, on the other hand, has high spatial and spectral resolution, but lacks frequency.
AVHRR, MODIS and ASTER teamed up as part of the Urgent Request Protocol. AVHRR data was initially used exclusively until 2011, when MODIS data was integrated into the system. AVHRR and MODIS identify temperature changes on Earth’s surface that could indicate volcanic activity. These areas are flagged as being potentially active. When they are flagged, these locations are sent automatically to the Urgent Request Protocol database, where a request is submitted that ASTER look at these locations more closely on its next opportunity.
This allows stakeholders to potentially track detailed changes on that site every time ASTER passes. Prior to 2011, scientists manually reviewed flagged hotspots before being submitted to the Urgent Request Protocol for imaging by ASTER.
One benefit of using MODIS data over AVHRR is that it allows the system to be automated because MODIS data has less noise than AVHRR and has a higher detection threshold, reducing the number of false positives detected. Additionally, MODIS data is part of a global system where as the volcanic monitoring from AVHRR is isolated to the north Pacific region.
Beyond its global reach, the Urgent Request Protocol is one of the longest running programs focused on mission operations and volcanic science. Stakeholders and scientists anticipate the launch of the Hyperspectral Infrared Imager (HyspIRI), which will have a thermal infrared imager similar to ASTER on board. Information acquired by ASTER is used in the development of HyspIRI and future thermal infrared sensors, contributing to the extended satellite record and the next generation of Earth observing satellites tracking volcanic threats from space.
Watching from their vantage point outside of Earth, satellites will continue to witness volcanic eruptions and volcanic activity. While no one satellite can see the whole picture, when multiple satellites with the ability to measure Earth’s temperature frequently or in great detail are used together like in the Urgent Request Protocol, people benefit. The strong foundation laid by the Urgent Request Protocol will allow new data from the next fleet of satellites to continue to help people prepare for volcanic incidents.