Month: February 2016

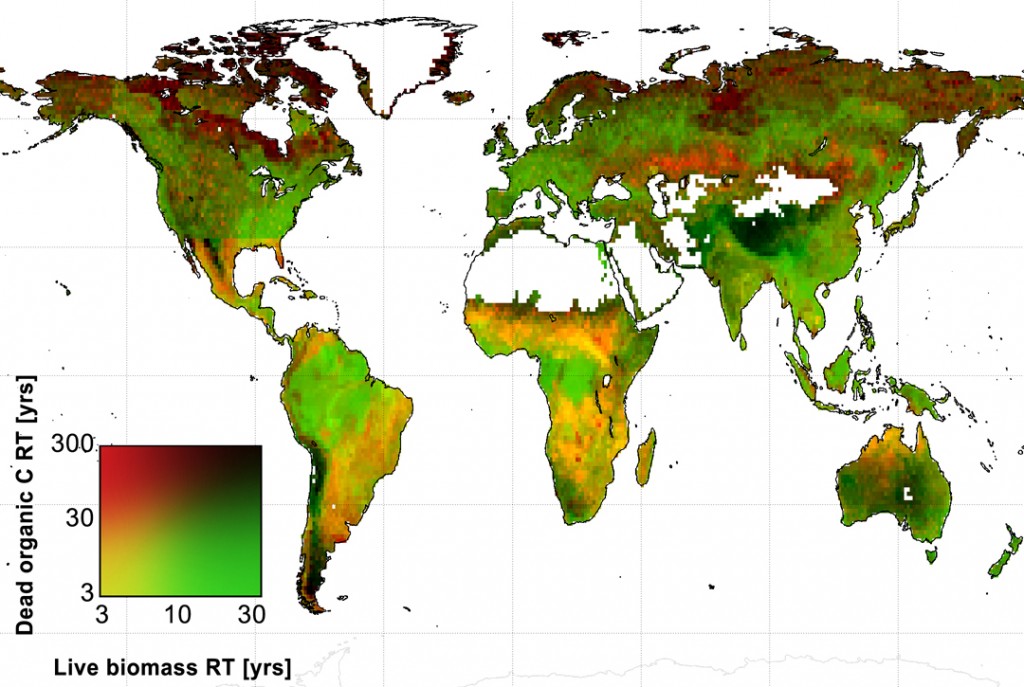
 Global map of the average amount of time that live biomass carbon and dead organic carbon spend in carbon reservoirs around the world, in years. Credit: A. Anthony Bloom

Global map of the average amount of time that live biomass carbon and dead organic carbon spend in carbon reservoirs around the world, in years. Credit: A. Anthony Bloom

February 8, 2016

New, detailed maps of the world’s natural landscapes created using NASA satellite data could help scientists better predict the impacts of future climate change.

The maps of forests, grasslands and other productive ecosystems provide the most complete picture yet of how carbon from the atmosphere is reused and recycled by Earth’s natural ecosystems.

Scientists at the University of Edinburgh, Scotland, United Kingdom; NASA’s Jet Propulsion Laboratory, Pasadena, California; and Wageningen University, Netherlands, used a computer model to analyze a decade of satellite and field study data from 2001 to 2010. The existing global maps of vegetation and fire activity they studied were produced from data from NASA’s Terra, Aqua and ICESat spacecraft. The researchers then constructed maps that show where — and for how long — carbon is stored in plants, trees and soils.

The maps reveal how the biological properties of leaves, roots and wood in different natural habitats affect their ability to store carbon across the globe, and show that some ecosystems retain carbon longer than others. For example, large swaths of the dry tropics store carbon for a relatively short time due to frequent fires, while in warm, wet climates, carbon is stored longer in vegetation than in soils.

Although it is well known that Earth’s natural ecosystems absorb and process large amounts of carbon dioxide, much less is known about where the carbon is stored or how long it remains there. Improved understanding about how carbon is stored will allow researchers to more accurately predict the impacts of climate change.

Study first author Anthony Bloom, a JPL postdoctoral scientist, said: “Our findings are a major step toward using satellite imagery to decipher how carbon flows through Earth’s natural ecosystems from satellite images. These results will help us understand how Earth’s natural carbon balance will respond to human disturbances and climate change.”

Professor Mathew Williams of the University of Edinburgh’s School of GeoSciences, who led the study, said, “Recent studies have highlighted the disagreement among Earth system models in the way they represent the current global carbon cycle. “Our results constitute a useful, modern benchmark to help improve these models and the robustness of global climate projections.”

To generate values for each of the 13,000 cells on each map, a supercomputer at the Edinburgh Compute and Data Facility ran the model approximately 1.6 trillion times.

New data can be added to the maps as it becomes available. The impact of major events such as forest fires on the ability of ecosystems to store carbon can be determined within three months of their occurrence, the researchers say.

The study, published Feb. 2 in the Proceedings of the National Academy of Sciences, was funded by the Natural Environment Research Council. The California Institute of Technology in Pasadena manages JPL for NASA.

NASA uses the vantage point of space to increase our understanding of our home planet, improve lives and safeguard our future. NASA develops new ways to observe and study Earth’s interconnected natural systems with long-term data records. The agency freely shares this unique knowledge and works with institutions around the world to gain new insights into how our planet is changing.

For more information about NASA’s Earth science activities, visit:

http://www.nasa.gov/earth


Media Contact

Alan Buis Jet Propulsion Laboratory, Pasadena, Calif.
818-354-0474
Alan.buis@jpl.nasa.gov

Corin Campbell
University of Edinburgh
011-44-0131-650-6382
Corin.campbell@ed.ac.uk

2016-037

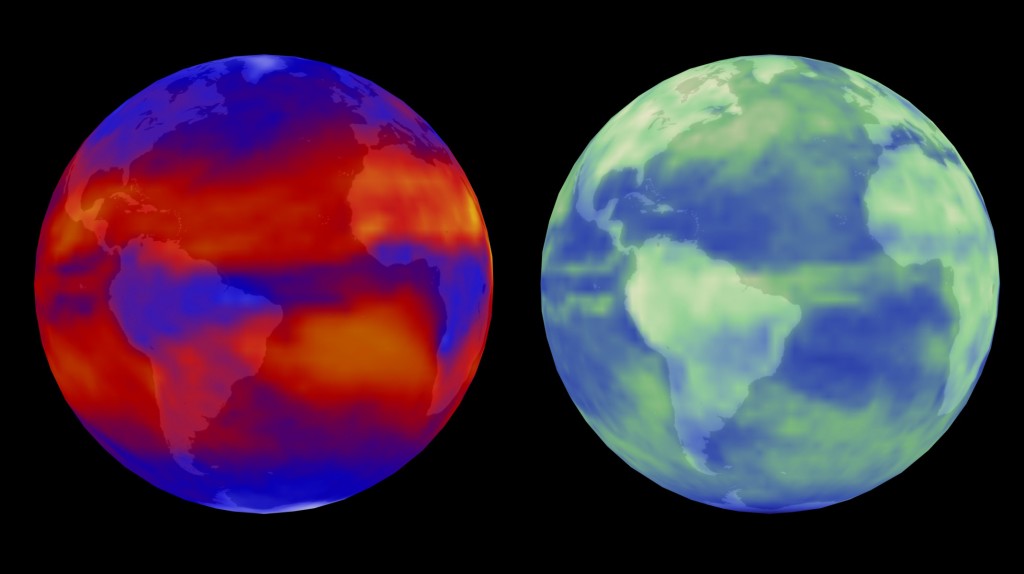
Terra/CERES views the world in outgoing longwave radiation (left) and reflected solar radiation (right). Image Credit: NASA

Terra/CERES views the world in outgoing longwave radiation (left) and reflected solar radiation (right). Image Credit: NASA

February 8, 2016

A study by scientists at NASA’s Jet Propulsion Laboratory in Pasadena, California, and Duke University in Durham, North Carolina, shows, in detail, the reason why global temperatures remain stable in the long run unless they are pushed by outside forces, such as increased greenhouse gases due to human impacts.

Lead author Patrick Brown, a doctoral student at Duke’s Nicholas School of the Environment, and his JPL colleagues combined global climate models with satellite measurements of changes in the energy approaching and leaving Earth at the top of the atmosphere over the past 15 years. The satellite data were from the Clouds and the Earth’s Radiant Energy System (CERES) instruments on NASA’s Aqua and Terra spacecraft. Their work reveals in new detail how Earth cools itself back down after a period of natural warming.

Scientists have long known that as Earth warms, it is able to restore its temperature equilibrium through a phenomenon known as the Planck Response. The phenomenon is an overall increase in infrared energy that Earth emits as it warms. The response acts as a safety valve of sorts, allowing more of the accumulating heat to be released through the top of Earth’s atmosphere into space.

The new research, however, shows it’s not quite as simple as that.

“Our analysis confirmed that the Planck Response plays the dominant role in restoring global temperature stability, but to our surprise, we found that it tends to be overwhelmed locally by heat-trapping changes in clouds, water vapor, and snow and ice,” Brown said. “This initially suggested that the climate system might be able to create large, sustained changes in temperature all by itself.”

A more detailed investigation of the satellite observations and climate models helped the researchers finally reconcile what was happening globally versus locally.

“While global temperature tends to be stable due to the Planck Response, there are other important, previously less appreciated, mechanisms at work, too,” said Wenhong Li, assistant professor of climate at Duke. These mechanisms include the net release of energy over anomalously cool regions and the transport of energy to continental and polar regions.  In those regions, the Planck Response overwhelms positive, heat-trapping local energy feedbacks.

“This emphasizes the importance of large-scale energy transport and atmospheric circulation changes in reconciling local versus global energy feedbacks and, in the absence of external drivers, restoring Earth’s global temperature equilibrium,” Li said.

The researchers say the findings may finally help put the chill on skeptics’ belief that long-term global warming occurs in an unpredictable manner, independently of external drivers such as human impacts.

“This study underscores that large, sustained changes in global temperature like those observed over the last century require drivers such as increased greenhouse gas concentrations,” said Brown.

“Scientists have long believed that increasing greenhouse gases played a major role in determining the warming trend of our planet,” added JPL co-author Jonathan Jiang. “This study provides further evidence that natural climate cycles alone are insufficient to explain the global warming observed over the last century.”

The research is published this month in the Journal of Climate. The study was funded by the National Science Foundation and NASA.

NASA uses the vantage point of space to increase our understanding of our home planet, improve lives and safeguard our future. NASA develops new ways to observe and study Earth’s interconnected natural systems with long-term data records. The agency freely shares this unique knowledge and works with institutions around the world to gain new insights into how our planet is changing.

For more information about NASA’s Earth science activities, visit:

http://www.nasa.gov/earth

Alan Buis
Jet Propulsion Laboratory, Pasadena, Calif.
818-354-0474
Alan.buis@jpl.nasa.gov

Tim Lucas
Duke University, Durham, North Carolina
919-613-8084
tdlucas@duke.edu

2016-036

February 1, 2016


Headshot of Ralph KahnNASA climate scientist Ralph Kahn presented a Maniac lecture at Goddard Space Flight Center entitled, “The Stories Data Tell.” At an early age, Ralph found that separating causality from coincidence can be the lynchpin of understanding, and at times can help identify prerogatives or highlight the path toward the better options. Ralph shared his experiences, professional, personal, and at the intersection of the two, where the difference seemed to matter. And how data can help address this challenge, providing evidence one way or the other – sometimes!

Ralph Kahn, a Senior Research Scientist at NASA’s Goddard Space Flight Center, received his PhD in applied physics from Harvard University. He spent 20 years as a Research Scientist and Senior Research Scientist at the Jet Propulsion Laboratory, where he studied climate change on Earth and Mars, and also led the Earth & Planetary Atmospheres Research Element. Kahn is Aerosol Scientist for the NASA Earth Observing System’s Multi-angle Imaging SpectroRadiometer (MISR) instrument on NASA’s Terra satellite. He focuses on using MISR’s unique observations, combined with other data and numerical models, to learn about wildfire smoke, desert dust, volcano and air pollution particles, and to apply the results to regional and global climate-change questions. Kahn has lectured on Climate Change and atmospheric physics at UCLA, Caltech and many other venues, and is editor and founder of PUMAS, the on-line journal of science and math examples for pre-college education.

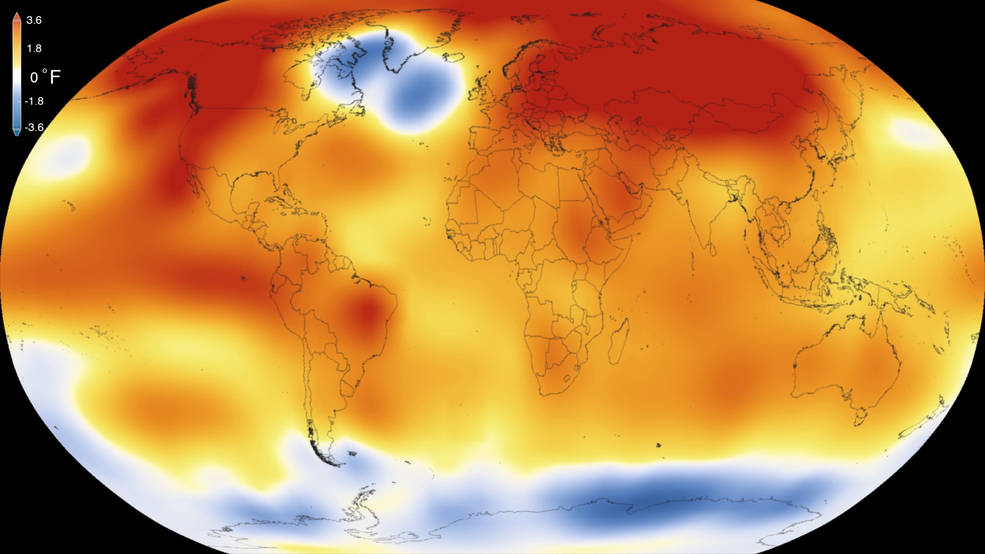
Global temperature anomolies

2015 was the warmest year since modern record-keeping began in 1880, according to a new analysis by NASA’s Goddard Institute for Space Studies. The record-breaking year continues a long-term warming trend — 15 of the 16 warmest years on record have now occurred since 2001. Credits: Scientific Visualization Studio/Goddard Space Flight Center

2015 was the hottest year ever recorded*, but what does Terra have to do with it?

On January 20th, 2016, scientists from NASA’s Goddard Institute for Space Studies (GISS) and National Oceanic and Atmospheric Administration (NOAA) released their analysis based on data gathered on Earth’s surface temperatures. There are two primary sources of data, ground measurements and satellite. While GISS and NOAA studies relied on surface-based measurements, data from satellite instruments, such as those on-board NASA’s Terra satellite are critical for better understanding of global temperatures as a function of time.

“The length and quality of the Terra data record makes it well suited as a check of the global temperature results and can help guide choices on ways to process the surface data,” according the Kurt Thome, Terra project scientist. Three of the Terra sensors have data that are well suited to serve as a validation source, allowing the researchers and scientists to go back and check their data. If surface and satellite measurements are the same, then the scientists responsible for creating the data products can conclude that the product is accurate. This increases confidence in the satellite data’s accuracy as well as verifying that the ground measurements are also accurate. When accurate data is put into the climate models the accuracy of the models is increased.

The Moderate Imaging Spectroradiometer (MODIS) measures Land Surface Temperatures (LST) and Sea Surface Temperatures (SST). There are two MODIS instruments in orbit, one on Terra and the other on Aqua. While the data analyzed in the NASA/NOAA report relies primarily on data from ground stations, the data gathered by MODIS can help “fill in the blanks” of areas where there are not many ground observations available. The data from MODIS, not only can be used to verify that ground instruments are working correctly, but it can also be used to add values to the climate models, that may otherwise be left blank.

The Advanced Spaceborne Thermal Emission and Reflection Radiometer (ASTER) also on NASA’s Terra Satellite, can sense temperature emissions, but at a higher resolution than MODIS.   In fact, ASTER is responsible for the highest resolution global emissivity database. While emissivity isn’t the same as land surface temperature the two are linked because how well a material emits combined with its temperature determines how much energy is given off. When temperatures rise, areas that were once vegetated can become arid causing a change in the emissivity and further changing how energy is distributed between vegetated and arid regions. ASTER, with its narrow swath and high resolution, required several years to create its global emissivity product. Combining the ASTER results with the daily MODIS measurements allows MODIS scientists to retrieve daily LST.

Finally, Clouds and the Earth’s Radiant Energy System (CERES) measures both emitted energy from the earth and solar-reflected energy. Combining these data with the amount of incident solar energy allows CERES scientists to do a full accounting of the Earth’s energy budget. Less reflected energy and greater emitted energy implies a warming planet. CERES, through measuring the amount of energy in the form of heat that is coming from Earth, can be used to validate ground measurements from weather stations. Conversely the ground stations can validate the measurements taken by CERES. Like MODIS and ASTER, this helps increase confidence in the current climate models.

While satellite monitoring of the Earth is relatively new compared the hundreds of years of historic records, satellite data is increasingly being used to help validate the most recent additions to the historic record. Satellite data allows scientists to get global coverage and increase confidence in the data that feeds climate models. Even though Earth is warming, satellite data are better equipped to model the increased temperatures and help citizens and policymakers understand the implications.


Read the press release from NASA GISS and NOAA

Read more on NASA’s Earth Observatory

*modern record keeping began in 1880.