Year: 2015

Aster Image of Patrick Island

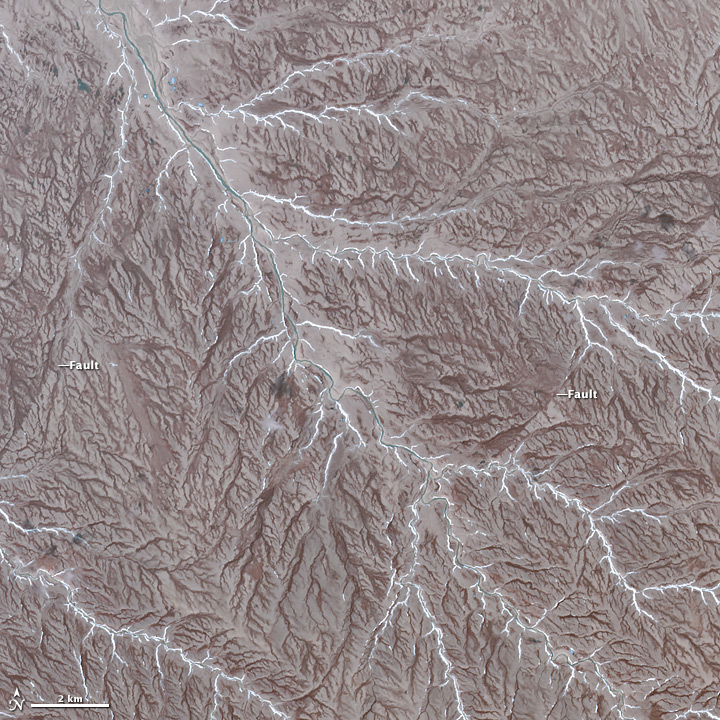
NASA Earth Observatory image by Jesse Allen, using data from NASA/GSFC/METI/ERSDAC/JAROS, and U.S./Japan ASTER Science Team.

The Advanced Spaceborne Thermal Emission and Reflection Radiometer (ASTER) on NASA’s Terra satellite, captured the image of Prince Patrick Island in Northern Canada. The image was featured on NASA’s Earth Observatory, showing the dendritic drainage pattern of interlocking steam and river channels, as well as, strike-slip faults, evidence of Prince Patrick’s seismic history. Prince Patrick Island is usually surrounded in sea ice, while temperatures average -33 degrees Celcius in January. This cold, inhospitable terrain is not a frequent travel destination, but through satellite imagery, much can be learned about this mostly uninhabited part of our planet.

Reported Rift Valley fever (RVF) case locations in relation to Land Use/Land Cover. Image courtesy of: Margaret M. Glancey, et al., 2015; Published by Mary Ann Liebert, Inc.

Reported Rift Valley fever (RVF) case locations in relation to Land Use/Land Cover. Image courtesy of: Margaret M. Glancey, et al., 2015; Published by Mary Ann Liebert, Inc.

Moderate Imaging Spectroradiometer (MODIS) data in the Normalized Difference Vegetation Index (NDVI), an index that shows plants “greenness” or photosynthetic activity, is helping better understand risk factors associated with Rift Valley Fever outbreaks in Southern Africa.

A recent study published in the National Center for Biotechnology Information’s Pub Med looked at epidemiological and environmental risk factors from 2008 – 2011, the worst outbreak of Rift Valley fever in almost 40 years.

Periods of widespread and above-normal rainfall are associated with Rift Valley Fever outbreaks. Researchers combined data from the World Animal Health Information Database (WAHID) on what types of species were affected, where and when with environmental factors including rainfall and NDVI.

The results of the study show that these environmental factors along with geographic factors (topography, drainage, and land use) do play a role in the emergence of Rift Valley Fever.

This study will help the accuracy of future models of areas at risk, allowing more time to adequately prepare and prevent future outbreaks.

Read the full article at http://www.ncbi.nlm.nih.gov/pubmed/26273812

Shorebird populations are struggling to find wetlands on their epic migrations down the Pacific Flyway, stemming from Alaska and Canada down to South America. As water resources have decreased in the Central Valley of California due to development, agriculture and other land use changes, resting and feeding grounds for migratory birds has decreased.

A team from Cornell Lab of Ornithology’s was able to use data from the Moderate Imaging Spectroradiometer (MODIS) on-board NASA’s Terra and Aqua satellites, along with data from Landsat to identify areas that could be turned into “pop-up habitats,” where rice fields could be flooded to provide temporary habitats for migrating birds for a couple weeks per year.

To identify areas that would be beneficial “pop-up habitats,” satellite data on the location and timing of surface water was matched with migration patterns of shorebirds collected from the eBird program, a citizen science bird watching program that collects data on bird sightings. The result is the BirdReturns program, a partnership between the Nature Conservancy and the California Rice Commission that compensates rice farmers to flood their rice fields at particular times to provide migratory habitat for shorebirds.

Efforts like this can help land managers better allocate valuable resources, such as water in California, where they are needed when competition for these resources are high.

Read more on NASA.gov

global.fallA recent study published in Nature now estimates that there are 3.04 trillion trees on Earth, a number that is almost 8 times higher than previous estimates

Scientists rely primarily on remotely-sensed to obtain estimates of global tree populations. Satellites provide the best opportunity to achieve a global perspective, but their view of tree forest canopies from above tends to obscure individual trees and shorter trees, making it difficult to make accurate estimates. In addition, satellites are limited by their spatial resolution, not every tree is as obvious as a Redwood alone in a field. The Redwood example also points to another complication, the definition of a tree, which for most studies, including the one in Nature, is vegetation with woody stems 10 cm in diameter or larger at chest height. Thus, counting trees is a difficult process because they can vary in size and can hide beneath the canopy of larger trees, as well as be too small to be seen in satellite images.

To get a better estimate of the actual number of trees on Earth, researchers combined data from multiple vegetation indexes, including the Enhanced Vegetation Index (EVI) from the Moderate Imaging Spectroradiometer (MODIS) onboard Terra, with actual tree counts for over 430,000 hectares from 14 different biomes on Earth (there is an estimated 4 million hectares of forested land on Earth). Merging the ground measurements and applying them to the different areas of land cover visible through satellite images resulted in the more accurate estimate of tree population possible with surprisingly large results.

Read more on nature.com

cedarfire_tmo_2003299Wildfires perpetuated by the Santa Ana winds can sweep through southern California in the fall and winter; where as, summer wildfires occur much earlier in the year. Both seasons are marked by approximately the same number of acres burned, but researchers recently quanitified which was more destructive.

To quantify each season’s destructiveness, data from the Moderate Imaging Spectroradiometer (MODIS) on-board Terra and Aqua on burn areas in southern California was combined with fire records and economic data to determine how destructive Santa Ana fires are compared to summer wildfires.

From their research they determined that Santa Ana fires caused about 80 percent more economic losses than the summer fires. MODIS data shows that Santa Ana fires may cover approximately the same area as summer fires, but spread more quickly and in the direction of more populated areas with higher property values than summer inland fires, explaining why the Santa Ana- fueled fires are more destructive.

Read more on NASA’s Earth Observatory

Read the entire paper from Environmental Research Letters