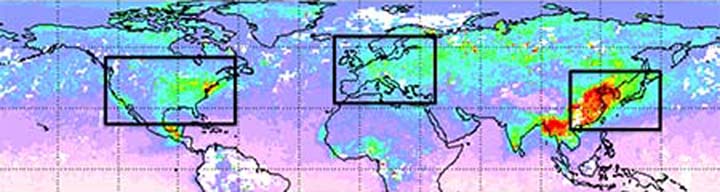
Changes in the MODIS sensor, not dark ice led scientists to incorrectly determine that the Greenland ice Sheet in the Arctic was darkening. These results and others led to improved calibration corrections in the Collection 6 reprocessing of Moderate Imaging Spectroradiometer (MODIS) data.
A recent study suggested that sensor degradation of the MODIS instrument on NASA’s Terra satellite was responsible for the incorrect data. Ironically, the high quality of the MODIS sensor is what initially led Arctic scientists to look for a subtle change in ice brightness. The data collected by MODIS led researchers to consider that the Greenland ice sheet was darkening from an increase in dark aerosol deposition on the snow. However, ground based measurements showed that there had been little if any change in the color of snow.
Ice darkening could have had big implications for climate researchers. Just like black asphalt absorbs radiation from the sun, resulting in a warmer surface temperature, the darkening of the ice sheet could warm the surface temperature around the snow, increasing snowmelt. This could result a shrinking Greenland ice sheet and have implications on sea level rise.
The combination of a well-understood sensor, high-quality analysis of the satellite data, and coordinated measurements at the surface led to the conclusion that a sensor artifact, a change to an image from defects or degradation of optics, was the culprit this time.
Satellites, like many scientific instruments, need to be calibrated to be able to maintain accuracy. If you’ve ever stepped on a scale and gotten a number that was far too high or too low to be accurate, you’ve been a witness to the degradation of an instrument. Scales can be fixed easily by taring, or resetting the instrument to zero when nothing is being weighed.
Fixing satellite sensor degradation, isn’t quite as easy, but is common practice. The complexity of an instrument like MODIS makes the calibration process much more difficult. Often, there are small instrument effects that are not obvious until many years of data from multiple applications indicate an issue. The dark ice example is one such case.
The vigilance of the MODIS scientists and those working with the instrument calibration led to five previous reprocessings with the sixth currently underway.. Each time the data is reprocessed, degradation of the instruments are taken into account and the data is calibrated based on data collected from other sensors on other satellites as well as from data collected on Earth. MODIS is on-board both Terra and Aqua, when data from these sensors don’t match up the data can be corrected based on data gathered on Earth.
While it may be easy to assume that an aging instrument may be less accurate, in reality the longer the data record that it collects, the more accurate the data can be through reprocessing. Just think, if Terra had only lasted it’s six year design life, instead of going on 16, this error in the data may never have been caught and accounted for in newer data collections.
Thus, while the dark ice example could be considered by some as an indication of a flaw in how satellite data are used, it is, in reality, a success story for how a community of scientists working with groups like the MODIS Characterization and Support Team are striving to get to the right answer.
References:
Sun, J., X. Xiong, A. Angal, H. Chen, A. Wu, and X. Geng, (2014) Time-Dependent Response Versus Scan Angle for MODIS Reflective Solar Bands,IEEE Transactions on Geoscience and Remote Sensing, 52 (6), 3159-3174.
Polashenski, C. M., J. E. Dibb, M. G. Flanner, J. Y. Chen, Z. R. Courville, A. M. Lai, J. J. Schauer, M. M. Shafer, and M. Bergin (2015), Neither dust nor black carbon causing apparent albedo decline in Greenland’s dry snow zone: Implications for MODIS C5 surface reflectance, Geophysical Research Letters, 42.
Atmospheric science: Arctic snow is not becoming dirtier. (2015, 29 October). Nature Research Highlights, Accessed November 25, 2015.