Year: 2014

Hagupit_tmo_2014338

The twenty-second tropical weather system (and eleventh typhoon) of the year in the Western Pacific Ocean had the potential to be one of the most damaging of 2014. In early December, Hagupit approached The Philippines as a major and slow-moving typhoon that threatened to hit the islands with torrential rain and a large storm surge. Hundreds of thousands of people were evacuated in the lead-up to the storm on December 5.

The Moderate Resolution Imaging Spectroradiometer (MODIS) on NASA’s Terra satellite acquired this image at 11:20 a.m. Palau time (0210 Universal Time) on December 4, 2014. At the time, Hagupit was a category 5 super typhoon with sustained winds of 155 knots (180 miles or 290 kilometers per hour). It was the fourth category 5 typhoon of the year in the Western Pacific.

read more

ASTER GED with Death Valley


ASTER GED Death Valley Color Bar

Image Credit: NASA/GSFC/METI/ERSDAC/JAROS, and U.S./Japan ASTER Science Team

Like the sun, Earth emits energy, yet this energy cannot be seen. Instead, it can be felt as heat because it is emitted in the thermal infrared wavelength range of the electromagnetic spectrum. While some energy in the electromagnetic spectrum can be seen in the form of light, other energy can only be felt as heat. For example, if you stand next to an oven or hover your hand over a hot burner you can feel the heat being emitted without directly touching either appliance. The strength of the energy emitted depends on both the temperature of the surface and how efficiently it can emit radiation, known as its emissivity.

The emissivity of most natural Earth surfaces is a unitless quantity and ranges between approximately 0.6 and 1.0, but surfaces with emissivities less than 0.85 are typically restricted to deserts and semi-arid areas. Vegetation, water and ice have high emissivities, above 0.95 in the thermal infrared wavelength range.

Instruments sensitive to thermal infrared radiation on-board NASA’s Earth Observing Satellites are designed to calculate Earth’s emissivity. The Advance Spaceborne Thermal Emission and Reflection Radiometer (ASTER) on-board Terra is one of these instruments. It calculates emissivity at 90 m spatial resolution for five different wavelengths in the thermal infrared spectrum. Scientists at NASA’s Jet Propulsion Laboratory in Pasadena, California produced the most detailed global map of emissivity by compositing millions of clear-sky images from ASTER, collected since its launch in 2000. This global map is the ASTER Global Emissivity Database (ASTER GED). ASTER GED is approximately 100 times more detailed than any other previous emissivity map produced by NASA.

Emissivity, unlike surface temperature, is an intrinsic property of the surface and does not depend on the angle of the sun in relationship to Earth or on local weather conditions. Instead emissivity variations occur due to land cover and use changes, as well as, the mineral composition of the land’s surface.

In the image, red areas (>0.95) have high emissivity and are covered with large amounts of vegetation, water, or ice. Blue areas (<0.8) have low emissivity and are indicative of quartz sands, which are found in arid regions such as the Sahara Desert in northern Africa. Transition areas from desert regions to more heavily vegetated regions, such as in the Sahel in Africa, appear green and yellow.

ASTER GED is a global, 90m spatial resolution emissivity map of the Earth’s non-frozen land surfaces at five different wavelengths in the thermal infrared spectrum. ASTER along with the Moderate Resolution Imaging Spectroradiometer (MODIS) on-board both Terra and Aqua and the Atmospheric Infrared Sounder (AIRS) on-board Aqua measure thermal infrared radiation. Therefore, the high resolution ASTER GED can be used to calibrate and validate these instruments coarser resolution estimates of emissivity at the kilometer-scale. ASTER GED is also being used for improving estimates of Earth’s surface temperature, atmospheric water vapor, and the accuracy of climate models, which currently have large uncertainties in their use of emissivity information.

Resources:

Jet Propulsion Laboratory Photojournal. (2014, October 20). NASA Spacecraft Maps Earth’s Global Emissivity. accessed October 23, 2014.

Land Processes Distributed Active Archive Center. (2014, April 2). ASTER Global Emissivity Database (GED) Product Release. Accessed October 7, 2014.

Joint Emissivity Database Initative (JEDI) Accessed October 7, 2014

ASTER-GED. Accessed October 23, 2014

albedo_change

NASA Earth Observatory images by Robert Simmon based on data from CERES. Caption by Mike Carlowicz.

Sunlight is the primary driver of Earth’s climate and weather. Averaged over the entire planet, roughly 340 watts per square meter of energy from the Sun reach Earth. About one-third of that energy is reflected back into space, and the remaining 240 watts per square meter is absorbed by land, ocean, and atmosphere. Exactly how much sunlight is absorbed depends on the reflectivity of the atmosphere and the surface.

As scientists work to understand why global temperatures are rising and how carbon dioxide and other greenhouse gases are changing the climate system, they have been auditing Earth’s energy budget. Is more energy being absorbed by Earth than is being lost to space? If so, what happens to the excess energy?

For seventeen years, scientists have been examining this balance sheet with a series of space-based sensors known as Clouds and the Earth’s Radiant Energy System, or CERES. The instruments use scanning radiometers to measure both the shortwave solar energy reflected by the planet (albedo) and the longwave thermal energy emitted by it. Read more

australia_tmo_2014280

NASA image courtesy Jeff Schmaltz, LANCE MODIS Rapid Response Team at NASA GSFC. Caption by Adam Voiland, with information from Daniel Lindsey (NOAA) and Rick McRae (Australian Capital Territory Emergency Services Agency).

The intense bushfires that strike southern Australia in the summer usually attract the most headlines, but the country’s largest and most frequent blazes actually occur in northern Australia in the spring. In fact, in terms of sheer area burned, satellite observations show that over 98 percent of large fires in Australia occur well outside of densely populated southeastern and southwestern parts of the country.

A fire that began burning in Northern Territory on September 10, 2014, offers a prime example of just how expansive fires from this part of the continent can become. After racing through grasslands for just a few weeks, the fire had charred an area about the size of Massachusetts by October 8, 2014.

The Moderate Resolution Imaging Spectroradiometer (MODIS) on NASA’s Terra satellite captured this sequence of images showing the progression of the fire.  Read more

CERES data over Pacific Ocean

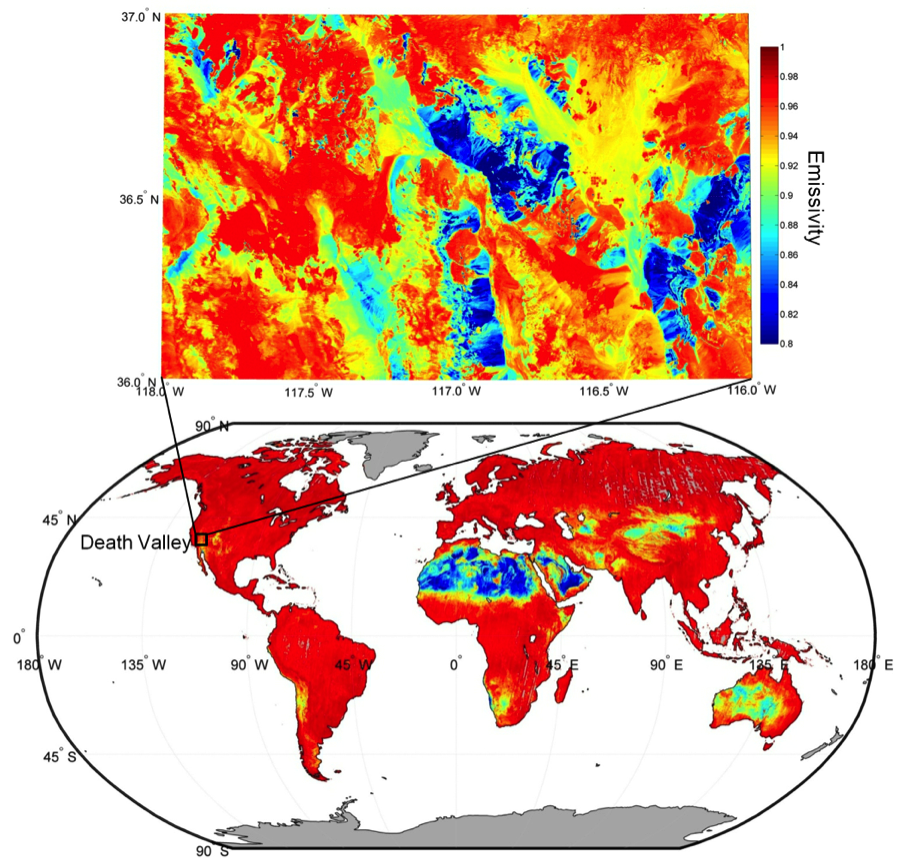
While the upper part of the world’s oceans continue to absorb heat from global warming, ocean depths have not warmed measurably in the last decade. This image shows heat radiating from the Pacific Ocean as imaged by the NASA’s Clouds and the Earth’s Radiant Energy System instrument on the Terra satellite. (Blue regions indicate thick cloud cover.)

The cold waters of Earth’s deep ocean have not warmed measurably since 2005, according to a new NASA study, leaving unsolved the mystery of why global warming appears to have slowed in recent years.

Scientists at NASA’s Jet Propulsion Laboratory (JPL) in Pasadena, California, analyzed satellite and direct ocean temperature data from 2005 to 2013 and found the ocean abyss below 1.24 miles (1,995 meters) has not warmed measurably. Study coauthor Josh Willis of JPL said these findings do not throw suspicion on climate change itself.

“The sea level is still rising,” Willis noted. “We’re just trying to understand the nitty-gritty details.”

In the 21st century, greenhouse gases have continued to accumulate in the atmosphere, just as they did in the 20th century, but global average surface air temperatures have stopped rising in tandem with the gases. The temperature of the top half of the world’s oceans — above the 1.24-mile mark — is still climbing, but not fast enough to account for the stalled air temperatures.

Many processes on land, air and sea have been invoked to explain what is happening to the “missing” heat. One of the most prominent ideas is that the bottom half of the ocean is taking up the slack, but supporting evidence is slim. This latest study is the first to test the idea using satellite observations, as well as direct temperature measurements of the upper ocean. Scientists have been taking the temperature of the top half of the ocean directly since 2005, using a network of 3,000 floating temperature probes called the Argo array.

“The deep parts of the ocean are harder to measure,” said JPL’s William Llovel, lead author of the study published Sunday in the journal Nature Climate Change. “The combination of satellite and direct temperature data gives us a glimpse of how much sea level rise is due to deep warming. The answer is — not much.”

The study took advantage of the fact that water expands as it gets warmer. The sea level is rising because of this expansion and the water added by glacier and ice sheet melt.

To arrive at their conclusion, the JPL scientists did a straightforward subtraction calculation, using data for 2005-2013 from the Argo buoys, NASA’s Jason-1 and Jason-2 satellites, and the agency’s Gravity Recovery and Climate Experiment (GRACE) satellites. From the total amount of sea level rise, they subtracted the amount of rise from the expansion in the upper ocean, and the amount of rise that came from added meltwater. The remainder represented the amount of sea level rise caused by warming in the deep ocean.

The remainder was essentially zero. Deep ocean warming contributed virtually nothing to sea level rise during this period.

Coauthor Felix Landerer of JPL noted that during the same period warming in the top half of the ocean continued unabated, an unequivocal sign that our planet is heating up. Some recent studies reporting deep-ocean warming were, in fact, referring to the warming in the upper half of the ocean but below the topmost layer, which ends about 0.4 mile (700 meters) down.

Landerer also is a coauthor of another paper in the same journal issue on 1970-2005 ocean warming in the Southern Hemisphere. Before Argo floats were deployed, temperature measurements in the Southern Ocean were spotty, at best. Using satellite measurements and climate simulations of sea level changes around the world, the new study found the global ocean absorbed far more heat in those 35 years than previously thought — a whopping 24 to 58 percent more than early estimates.

Both papers result from the work of the newly formed NASA Sea Level Change Team, an interdisciplinary group tasked with using NASA satellite data to improve the accuracy and scale of current and future estimates of sea level change. The Southern Hemisphere paper was led by three scientists at Lawrence Livermore National Laboratory in Livermore, California.

NASA monitors Earth’s vital signs from land, air and space with a fleet of satellites and ambitious airborne and ground-based observation campaigns. NASA develops new ways to observe and study Earth’s interconnected natural systems with long-term data records and computer analysis tools to better see how our planet is changing. The agency shares this unique knowledge with the global community and works with institutions in the United States and around the world that contribute to understanding and protecting our home planet.

For more information about NASA’s Earth science activities in 2014, visit:

http://www.nasa.gov/earthrightnow

For more information on ocean surface topography from space, visit:

http://sealevel.jpl.nasa.gov

More information on NASA’s GRACE satellites is available at:

http://grace.jpl.nasa.gov

For more information on the Argo array, visit:

http://www.argo.ucsd.edu/index.html