Category: News and Events

News and Events

pilger_ast_2014172

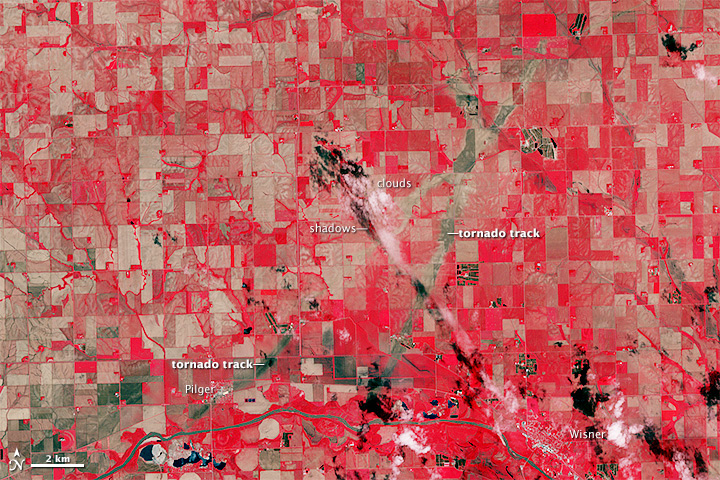
On June 16, 2014, a tornadic thunderstorm system moved across portions of northeast Nebraska, producing 5 tornadoes. Four of the tornadoes were rated as EF-4 on the Enhanced Fujita Scale, meaning that they were violent tornadoes with winds between 166 and 200 miles per hour. One EF-4 tornado spun directly through Pilger, Nebraska, a small town of 350 people, leveling much of the town.

The Advanced Spaceborne Thermal Emission and Reflection Radiometer (ASTER) instrument aboard NASA’s Terra satellite captured the top image of northeast Nebraska on June 21, 2014. Two of the EF-4 tornado tracks are visible in the false-color image (near-infrared, red, green). The tracks are tan paths of bare ground across plant-covered fields, which are red. The towns of Pilger and Wisner are bright white. The lower image, also from the ASTER instrument, shows the region on July 4, 2013. Turn on the comparison tool to contrast the before and after views. Read more

NASA Earth Observatory image by Jesse Allen, using data from NASA/GSFC/METI/ERSDAC/JAROS, and U.S./Japan ASTER Science Team. Caption by Kari Beckendorf and Holli Riebeek.

india_lsta_20140602-09

In the first half of June 2014, news accounts described an extreme heatwave in India, as well as the late and somewhat weak arrival of the seasonal monsoon. Air temperatures in New Delhi climbed as high as 48° Celsius (118° Fahrenheit) and stayed above 43°C (110°F) for seven days. Satellite data offer some insights on what was happening on the ground.

The maps above show land surface temperature (LST) anomalies for southern Asia from June 2–9 and June 10–17, 2014. LST anomalies are not absolute temperatures; instead, they show how much the land surface was heated above or below the average. The darkest reds show areas where the ground was as much as 12°C (22°F) above the norm from 2001–2010; blues show areas that were below normal; and grays depicts areas with incomplete data (usually due to excessive cloud cover). Read more

Parana_tmo_2014162

Torrential rain brought deadly floods to southern Brazil and Paraguay in June 2014. The top image, acquired by the Moderate Resolution Imaging Spectroradiometer (MODIS) on NASA’s Terra satellite on June 11, 2014, shows flooding in the Paraná River system in Brazil’s Paraná state. The Ivaí, Piquiri, and Paraná rivers are all swollen and muddy from runoff. The lower image, acquired by Terra MODIS on June 12, 2012, shows the river system in non-flood conditions. Turn on the image comparison tool to see the extent of the flooding. Read more

NASA image courtesy LANCE/EOSDIS MODIS Rapid Response Team at NASA GSFC. Caption by Holli Riebeek.

cristina_tmo_2014163

When the Moderate Resolution Imaging Spectroradiometer (MODIS) on NASA’s Aqua satellite acquired this image at 10:40 a.m. local time (17:40 Universal Time) on June 12, 2014, Tropical Cyclone Cristina was churning over the eastern Pacific Ocean off the coast of Mexico. The storm had maximum sustained winds near 240 kilometers (150 miles) per hour, making it the equivalent of a category 4 hurricane. The storm was moving west-northwest at a speed of 13 kilometers (8 miles) per hour. Read more

NASA image courtesy of the LANCE/EOSDIS MODIS Rapid Response Team at NASA GSFC. Caption by Adam Voiland.

california_tmo_2011017

From time to time, in the wake of winter rain, dense fog fills the wide valley between California’s Sierra Nevada and Coastal Range. Called Tule fog, the phenomenon is as much a part of winter in the Central Valley as snow is in the mountain. In recent years, however, the fog has come less often. In fact, since 1981 the number of fog days between November and February has decreased by 46 percent, according to a recent study. The decrease is bad news for California’s fruit and nut farmers.

This image, acquired on January 17, 2011, by the Moderate Resolution Imaging Spectroradiometer (MODIS) on NASA’s Terra satellite, shows one of the more recent valley fog events. (Drought has limited the number of fog events since 2012.) University of California–Berkeley researchers Dennis Baldocchi and Eric Waller used images from MODIS and from NOAA’s advanced very high resolution radiometer (AVHRR) to count the number of fog days since 1981. They found a downward trend. Read more

NASA Earth Observatory image by Jesse Allen with data from the Land Atmosphere Near real-time Capability for EOS (LANCE). Caption by Holli Riebeek.