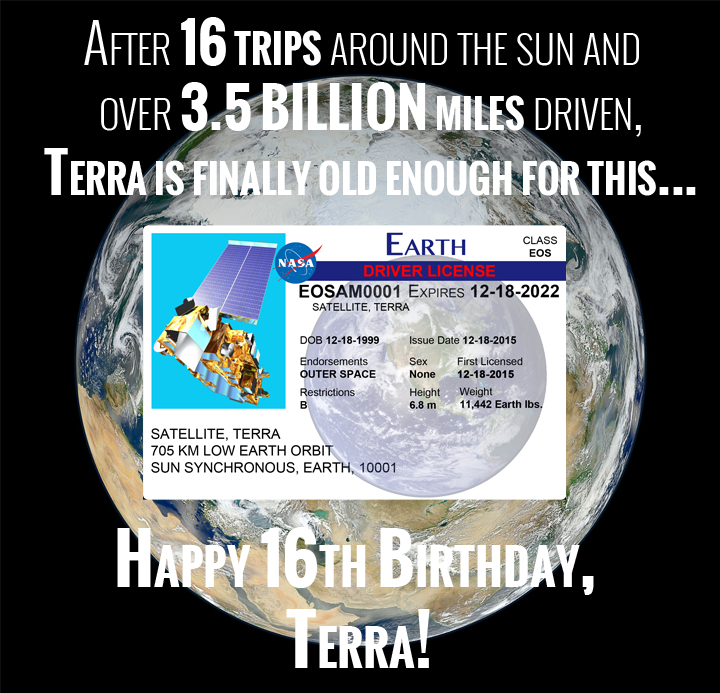
Celebrate Terra’s 16th anniversary with us. Print your own Terra Driver License!
By the time most people turn 16 they have only driven a few hundred miles and much of that just around their hometown. Orbiting Earth more than 80,000 times, NASA’s Terra satellite traveled over 3.5 billion miles. More miles than 18,000 cars can drive in their lifetime, but Terra does it on one tank of fuel. While it’s not exactly the same fuel that powers cars, it is filled with about 340 kg of hydrazine. 340 kg of gasoline wouldn’t even fill one semi truck’s gas tank.
While most of Terra’s energy comes from an array of photovoltaic cells, capturing energy from the sun, Terra still needs some fuel to maintain its orbit and avoid space debris. However, most of its fuel was used getting to its current orbit. The next time it will use much of its remaining fuel will be when it moves to a new, lower orbit to allow Terra to share the road with newer satellites in similar orbits.
The length of a satellite mission depends not just on the longevity of its sensors, but also on the amount of fuel in its reservoir to safely exit the orbit. Terra currently has enough fuel to maintain its orbit into the early 2020s and to avoid space debris well after that. Data will continue to be collected at this point, but will be of a different nature because of the eventual drift in Terra’s orbit.
Terra’s Mission Operations Team, in cooperation with Terra scientists, plans for multiple scenarios and works to ensure that the data Terra collects continues to be meaningful for scientific research. Even small changes in a satellite’s orbit can affect the data that it collects. Changing crossing time, the time of day at which a polar orbiting satellite crosses the equator, and altitude can affect the quality of the data collected. The Mission Operations Team works directly with the scientists that use the data, to make sure that any changes have minimal effects.
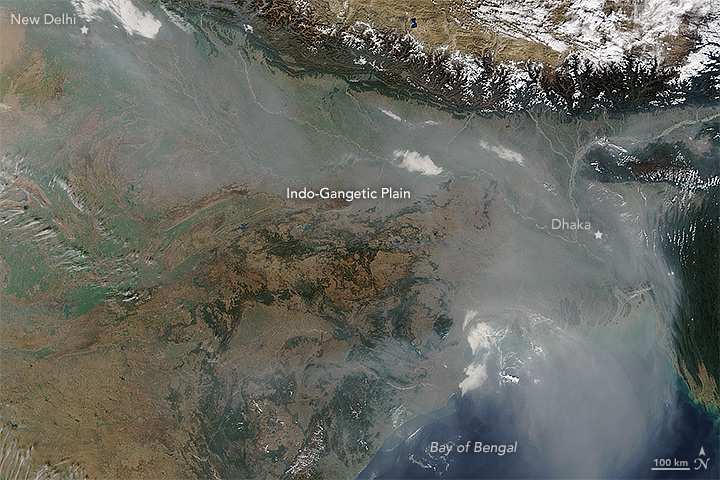
Since Terra’s launch on December 18, 1999, Terra’ s data has been used in a number of applications and has contributed greatly to the satellite climate data record.
Terra carries five sensors: Advanced Spaceborne Thermal Emission Reflection Radiometer (ASTER), Clouds and Earth’s Radiant Energy System (CERES), Multi-angle Imaging SpectroRadiometer (MISR), Moderate-resolution Imaging Spectroradiometer (MODIS), and Measurements of Pollution in the Troposphere (MOPITT). All of Terra’s five sensors contribute to atmospheric science research. MODIS, MISR, and ASTER contribute to cloud property research while CERES, MODIS, and MISR are being used to monitor the Earth’s energy balance and imbalances. MOPITT, MISR and MODIS collect integral information on air quality, which is used to contribute to air quality and climate models as well as to assist researchers in testing the monitoring capabilities of future satellite programs.
MODIS, MISR and ASTER continue to collect data on land cover, including fires and volcanic effects. This data directly benefits people on the ground. ASTER data is responsible for the most detailed digital elevation model of the entire earth, making climate models more accurate as elevation impacts weather and climate patterns. MODIS and ASTER are tracking changes in vegetation, volcanic activity and fire occurrence. MODIS data was integral in attempts to monitor forest fires from space with the development of MODIS Rapid Response. This fight now has another companion, VIIRS on board Suomi-NPP, a joint satellite mission between NASA and NOAA. While MODIS Rapid Response continues to be used for forest fire monitoring, VIIRS data is also being applied to the algorithms, allowing more rapid detection of even smaller forest fires. Using data from both MODIS and VIIRS, this new application was recently adopted by the US Forest Service.
Without the scientific achievements of Terra and the five sensors carried on-board, the next generation of satellite sensors would not be as advanced or be able to collect meaningful data to continue the scientific research pioneered by Terra.
While Terra is not being replaced, Terra scientists eagerly await the launch of Sentinel 3 by the European Space Agency in the next month. Sentinel 3 carries the Ocean Land Colour Instrument (OLCI), which is similar to MODIS on Terra and Sentinel 3 will also have a morning crossing time like Terra.
Terra won’t last forever, but its legacy will carry on in the future of remote sensing. For Terra, its not just about Earth system science, its about helping shape the future of satellite imaging, while continuing to collect meaningful data until the next generation of satellites are in place to continue the work started by Terra.
References:
Battling Wildfires from Space: NASA Adds to Firefighters’ Toolkit (2015, 16 July). NASA Benefits to You, Accessed December 5, 2015.
Chohan, Rani, Scientists Confirm Earth’s Energy Is Out of Balance (2005, 28 April). Accessed December 5, 2015.
Smith, Jeff. Tracking air quality from high in the sky (2015, 21 October). Atmospheric News. Accessed November 14, 2015.
Owen, Tassia. ASTER Global Emissivity Database: 100 Times More Detailed than its Predecessors (2014, 17 November) Terra News. Accessed December 13, 2015


 NASA climate scientist Ralph Kahn presented a Maniac lecture at Goddard Space Flight Center entitled, “The Stories Data Tell.” At an early age, Ralph found that separating causality from coincidence can be the lynchpin of understanding, and at times can help identify prerogatives or highlight the path toward the better options. Ralph shared his experiences, professional, personal, and at the intersection of the two, where the difference seemed to matter. And how data can help address this challenge, providing evidence one way or the other – sometimes!
 January 30, 2016
 January 26, 2016
 January 25, 2016
 January 16, 2016
 January 15, 2016
 January 12, 2016
 January 11, 2016
 January 8, 2016
 January 3, 2016
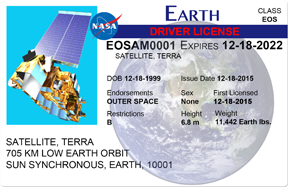