Credits: NASA/Tim Marvel
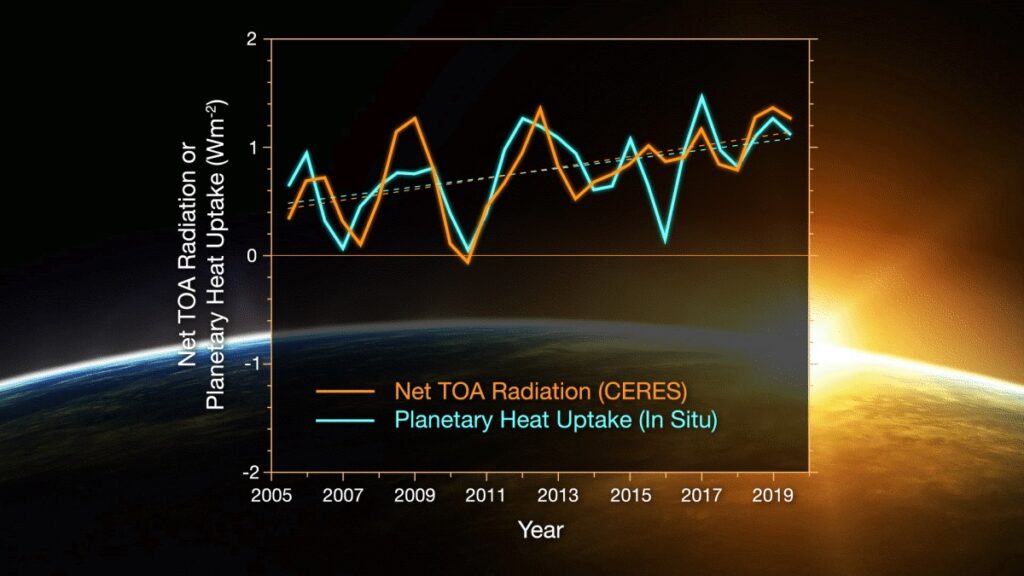
Researchers have found that Earth’s energy imbalance approximately doubled during the 14-year period from 2005 to 2019.
Earth’s climate is determined by a delicate balance between how much of the Sun’s radiative energy is absorbed in the atmosphere and at the surface and how much thermal infrared radiation Earth emits to space. A positive energy imbalance means the Earth system is gaining energy, causing the planet to heat up. The doubling of the energy imbalance is the topic of a recent study, the results of which were published June 15 in Geophysical Research Letters.
Scientists at NASA and NOAA compared data from two independent measurements. NASA’s Clouds and the Earth’s Radiant Energy System (CERES) suite of satellite sensors measure how much energy enters and leaves Earth’s system. In addition, data from a global array of ocean floats, called Argo, enable an accurate estimate of the rate at which the world’s oceans are heating up. Since approximately 90 percent of the excess energy from an energy imbalance ends up in the ocean, the overall trends of incoming and outgoing radiation should broadly agree with changes in ocean heat content.
“The two very independent ways of looking at changes in Earth’s energy imbalance are in really, really good agreement, and they’re both showing this very large trend, which gives us a lot of confidence that what we’re seeing is a real phenomenon and not just an instrumental artifact, ” said Norman Loeb, lead author for the study and principal investigator for CERES at NASA’s Langley Research Center in Hampton, Virginia. “The trends we found were quite alarming in a sense.”
Increases in emissions of greenhouse gases such as carbon dioxide and methane due to human activity trap heat in the atmosphere, capturing outgoing radiation that would otherwise escape into space. The warming drives other changes, such as snow and ice melt, and increased water vapor and cloud changes that can further enhance the warming. Earth’s energy imbalance is the net effect of all these factors. In order to determine the primary factors driving the imbalance, the investigators used a method that looked at changes in clouds, water vapor, combined contributions from trace gases and the output of light from the Sun, surface albedo (the amount of light reflected by the Earth’s surface), tiny atmospheric particles called aerosols, and changes in surface and atmospheric temperature distributions.
The study finds that the doubling of the imbalance is partially the result an increase in greenhouse gases due to human activity, also known as anthropogenic forcing, along with increases in water vapor are trapping more outgoing longwave radiation, further contributing to Earth’s energy imbalance. Additionally, the related decrease in clouds and sea ice lead to more absorption of solar energy.
The researchers also found that a flip of the Pacific Decadal Oscillation (PDO) from a cool phase to a warm phase likely played a major role in the intensification of the energy imbalance. The PDO is a pattern of Pacific climate variability. Its fingerprint includes a massive wedge of water in the eastern Pacific that goes through cool and warm phases. This naturally occurring internal variability in the Earth system can have far-reaching effects on weather and climate. An intensely warm PDO phase that began around 2014 and continued until 2020 caused a widespread reduction in cloud coverage over the ocean and a corresponding increase in the absorption of solar radiation.
“It’s likely a mix of anthropogenic forcing and internal variability,” said Loeb. “And over this period they’re both causing warming, which leads to a fairly large change in Earth’s energy imbalance. The magnitude of the increase is unprecedented.”
Loeb cautions that the study is only a snapshot relative to long-term climate change, and that it’s not possible to predict with any certainty what the coming decades might look like for the balance of Earth’s energy budget. The study does conclude, however, that unless the rate of heat uptake subsides, greater changes in climate than are already occurring should be expected.
“The lengthening and highly complementary records from Argo and CERES have allowed us both to pin down Earth’s energy imbalance with increasing accuracy, and to study its variations and trends with increasing insight, as time goes on.” said Gregory Johnson, co-author on the study and physical oceanographer at the National Oceanic and Atmospheric Administration’s Pacific Marine Environmental Laboratory in Seattle, Washington. “Observing the magnitude and variations of this energy imbalance are vital to understanding Earth’s changing climate.”
Joe Atkinson
NASA’s Langley Research CenterLast Updated: Jun 16, 2021Editor: Joe Atkinson
Link to original article: https://www.nasa.gov/feature/langley/joint-nasa-noaa-study-finds-earths-energy-imbalance-has-doubled/